

Release Date :
Reference Number :
SR-202501-0800-05
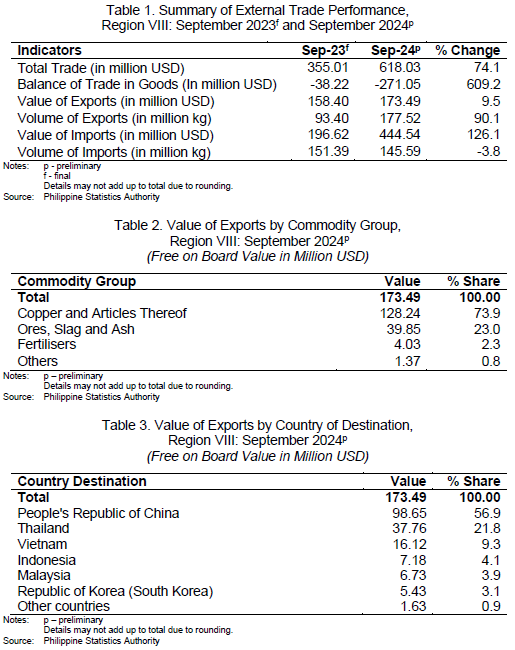
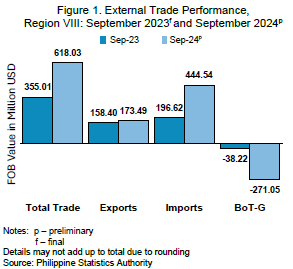 The region’s total external trade in goods in September 2024 surged to USD 618.03 million, posting an increase of 74.1 percent from USD 355.01 million total trade in September 2023.
Of the total external trade in September 2024, 28.07 percent were exported goods, while 71.9 percent were imported goods.
The value of exports in September 2024 was recorded at USD 173.49 million posting an increase of 9.5 percent from USD 158.40 million in September 2023. The value of imports in September 2024 soared to USD 444.54 million, indicating an increase of 126.1 percent from USD 196.62 million in September 2023.
The balance of trade in goods (BoT-G) in September 2024 was recorded at USD -271.05 million, indicating a trade deficit which widened by 609.2 percent from USD -38.22 million BoT-G in the same month of 2023.
EXPORTS
 The total volume of goods exported by the region in September 2024 was 177.52 million kilograms, higher by 90.1 percent compared with the 93.40 million kilograms of exports in September 2023.
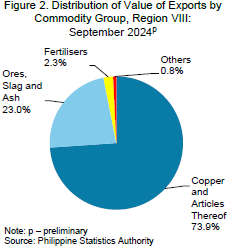
Copper and articles thereof commodity group dominated the export market with sales amounting to USD 128.24 million in September 2024. This accounted 73.9 percent of the total value of exports during the month. This was followed by the commodity group of ores, slag and ash valued at USD 39.85 million or 23.0 percent of the region’s total exports in September 2024. Fertilisers came next valued at USD 4.03 million or 2.3 percent of the region’s total exports. Other commodity groups contributed less than one percent to the region’s total exports in September 2024 (Table 2).
The People’s Republic of China was the main export market with USD 98.65 million worth of exports or more than half (56.9%) of the total value of exports in September 2024. Completing the top five (5) export destinations were Thailand with USD 37.76 million (21.8%); Vietnam with USD 16.12 million (9.3%); Indonesia with USD 7.18 million (4.1%); and Malaysia with USD 6.73 million (3.9%) (Table 3).
IMPORTS
The total volume of goods imported into the region in September 2024 was 145.59 million kilograms, lower by 3.8 percent than the 151.39 million kilograms in September 2023.
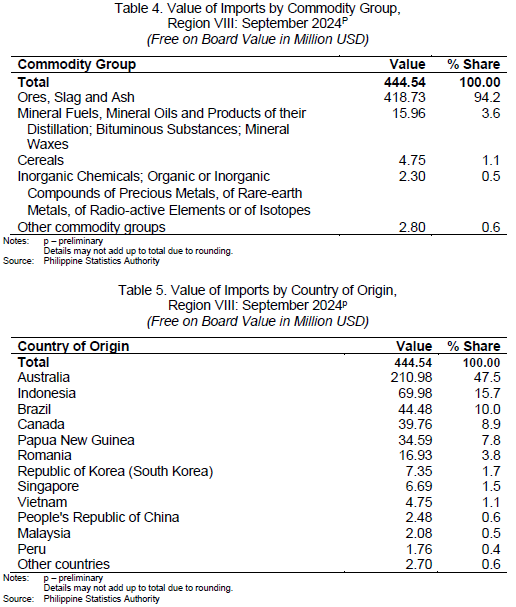
The commodity group of ores, slag and ash valued at USD 418.73 million comprised 94.2 percent of the total value of imports in September 2024. This was followed by mineral fuels, mineral oils and products of their distillation; bituminous substances; mineral waxes commodity group worth USD 15.96 million or 3.6 percent of the region's total value of imports in September 2024. Cereals commodity group worth USD 4.75 million comprised 1.1 percent of the region's total value of imports during the month in review. The commodity group of inorganic chemicals; organic or inorganic compounds of precious metals, of rare-earth metals, of radio-active elements or of isotopes valued at USD 2.30 million comprised 0.5 percent of the total value of imports during the period in review. Other commodity groups contributed less than one percent to the region’s total imports in September 2024 (Table 4).
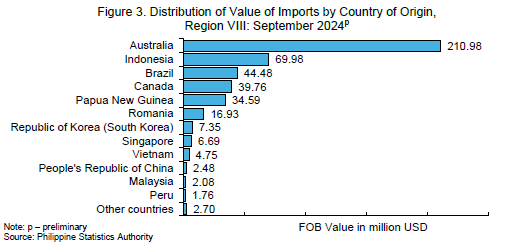
The major import supplier was Australia which accounted for USD 210.98 million or 47.5 percent of the total value of imports of the region in September 2024. The rest of the top five (5) import suppliers during the month were Indonesia with USD 69.98 million (15.7%); Brazil with USD 44.48 million (10.0%); Canada with USD 39.76 million (8.9%); and Papua New Guinea with USD 34.59 million (7.8%) (Figure 3 and Table 5).
Technical Notes
Export and Import Trade Statistics are compiled by the Philippine Statistics Authority (PSA) from copies of export and import documents submitted to the Bureau of Customs (BOC) by exporters and importers or their authorized representatives as required by law. PSA collects copies of the following accomplished forms:
1. Export Declaration (ED – DTI form)
2. Import Entry & Internal Revenue Declaration (BOC IEIRD Form 236)
3. Informal Import Declaration and Entry (BOC Form 177)
4. Single Administrative Documents (SAD)
The output of the Automated Export Documentation System (AEDS) of the BOC is being utilized to generate export statistics. AEDS is a paperless transaction in lieu of the manual filling-up of export documents.
Moreover, an electronic copy of the IEIRD, or SAD, is utilized to capture the monthly import figures. SAD-IEIRD is an on-line submission of import documents either by brokers or companies. These are transactions that pass through the Automated Cargo Operating System (ACOS), now called the e2m (electronic to mobile) customs system, a system implemented through the BOC e-Customs Project.
All documents (hard copies and e-files) received before the cut-off date which is every 25th day of the month, are compiled, processed and generated in monthly statistical tables for the preparation of Press Release. All documents received after the cut-off date, however, are processed and included in the generation of the revised monthly statistical tables. Final data revisions are made annually during the first quarter after the reference year to include documents received after the monthly revisions.
The digitized copies of all documents are provided by BOC and PEZA to PSA on a monthly basis through email.
The 2022 Philippine Standard Commodity Classification (PSCC) is used to classify the commodities at the most detailed 10-digit code level for statistical purposes.
SGD. WILMA A. PERANTE
Regional Director
| Attachment | Size |
|---|---|
|
|
1.01 MB |