

Release Date :
Reference Number :
SR-202506-0800-20
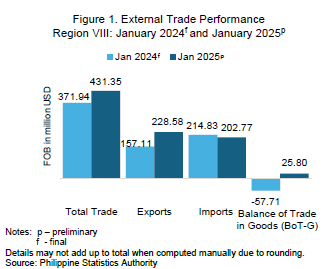 In January 2025, Eastern Visayas posted a balance of trade in goods (BoT-G) worth USD 25.80 million, indicating a trade surplus in contrast to the USD 57.51 million trade deficit in January 2024 (Figure 1).
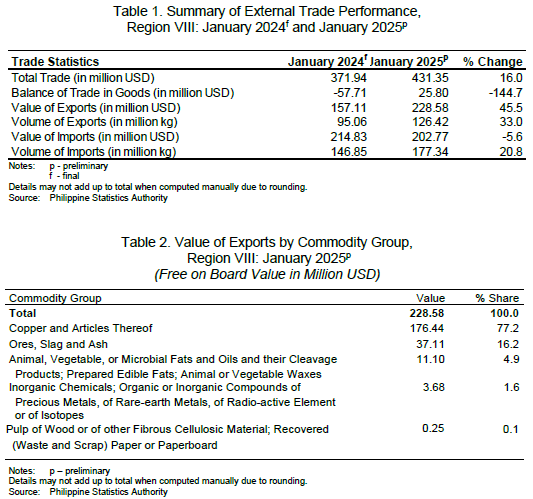
The total value of exports in January 2025 was USD 228.58 million, up by 45.5 percent from the USD 157.11 million exports in January 2024. Meanwhile, the total value of imports was USD 202.77 million, posting a 5.6 percent decline from the USD 214.83 million total value of imports in January 2024.
Total external trade in January 2025 was USD 431.35 million indicating a 16.0 percent increase compared with the USD 371.94 million total trade in January 2024.
EXPORTS
 The total volume of goods exported by the region increased by 33.0 percent from 95.06 million kilograms in January 2024 to 126.42 million kilograms in January 2025 (Table 1).
By commodity group, exports of copper and articles thereof worth USD 176.44 million comprised the bulk or 77.2 percent of the region’s total export in January 2025. This was followed by ores, slag and ash commodity group worth USD 37.11 million which comprised 16.2 percent of the exports during the month. Trailing behind with 4.9 percent and 1.6 percent shares to the total export sales, respectively, were the commodity groups of animal, vegetable, or microbial fats and oils and their cleavage products; prepared edible fats; animal or vegetable waxes worth USD 11.10 million; and inorganic chemicals; organic or inorganic compounds of precious metals, of rare-earth metals, of radio-active elements or of isotopes commodity group worth USD 3.68 million. Pulp of wood or of other fibrous cellulosic material; recovered (waste and scrap) paper or paper board commodity group contributed USD 0.25 million to the total value of exports of the region in January 2025, representing 0.1 percent only of the total exports in January 2025 (Table 2).
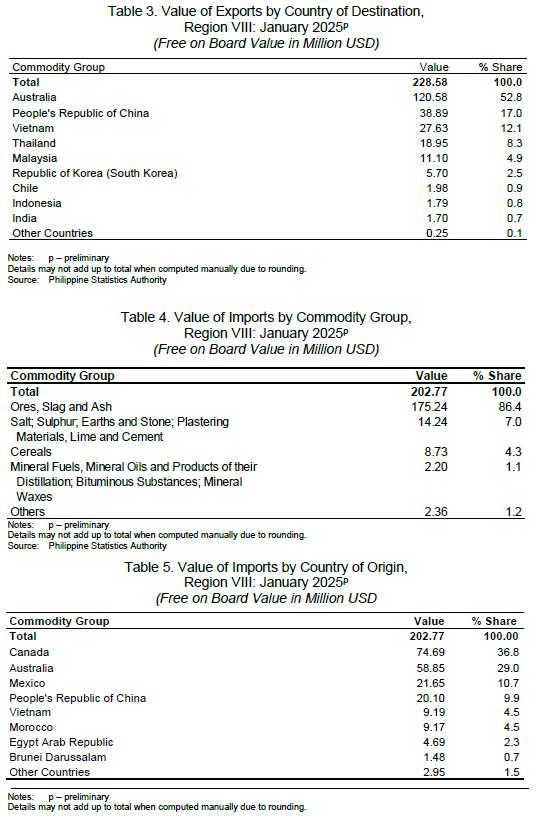
Australia, the major export market in January 2025 with USD 120.58 million worth of exports comprised more than half (52.8%) of the total value of exports in January 2025. Completing the top five (5) export destinations were People’s Republic of China with USD 38.89 million (17.0%); Vietnam with USD 27.63 million (12.1%); Thailand with USD 18.95 million (8.3%); and Malaysia with USD 11.10 million (4.9%) (Table 3).
IMPORTS
The total volume of goods imported into the region in January 2025 was 177.34 million kilograms, posting an increase of 20.8 percent from the 146.85 million kilograms of goods imported in January 2024.
Ores, slag, and ash commodity group with a value of USD 175.24 million comprised the bulk (86.4%) of the total value of imports in January 2025. Lagging behind was the commodity group of salt; sulphur; earths and stone; plastering materials, lime and cement worth USD 14.24 million (7.0%). Cereals commodity group contributed USD 8.73 million (4.3%), while mineral fuels, mineral oils and products of their distillation; bituminous substances; mineral waxes commodity group shared USD 2.20 million (1.1%). Other commodity groups contributed USD 2.36 million (1.2%) to the total value of import in January 2025 (Table 4).
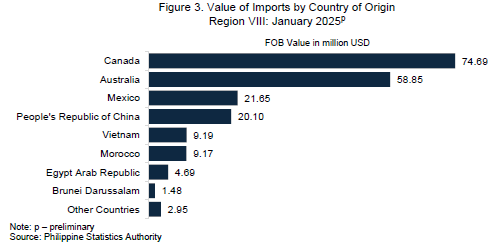
Canada supplied more than one-third (36.8%) or USD 74.69 million of the region’s total value of imports. The proportion of imports from Australia came next at 29.0 percent valued at USD 58.85 million or more than a quarter (29.0%) of the total value of imports in January 2025. The rest of the top five (5) import suppliers during the month were Mexico with USD 21.65 million (10.7%); People’s Republic of China with USD 20.10 million (9.9%); and Vietnam with USD 9.19 million (4.5%) (Figure 3 and Table 5).
Technical Notes
Export and Import Trade Statistics are compiled by the Philippine Statistics Authority (PSA) from copies of export and import documents submitted to the Bureau of Customs (BOC) by exporters and importers or their authorized representatives as required by law. PSA collects copies of the following accomplished forms:
1. Export Declaration (ED – DTI form)
2. Import Entry & Internal Revenue Declaration (BOC IEIRD Form 236)
3. Informal Import Declaration and Entry (BOC Form 177)
4. Single Administrative Documents (SAD)
The output of the Automated Export Documentation System (AEDS) of the BOC is being utilized to generate export statistics. AEDS is a paperless transaction in lieu of the manual filling-up of export documents.
Moreover, an electronic copy of the IEIRD, or SAD, is utilized to capture the monthly import figures. SAD-IEIRD is an on-line submission of import documents either by brokers or companies. These are transactions that pass through the Automated Cargo Operating System (ACOS), now called the e2m (electronic to mobile) customs system, a system implemented through the BOC e-Customs Project.
All documents (hard copies and e-files) received before the cut-off date which is every 25th day of the month, are compiled, processed and generated in monthly statistical tables for the preparation of Press Release. All documents received after the cut-off date, however, are processed and included in the generation of the revised monthly statistical tables. Final data revisions are made annually during the first quarter after the reference year to include documents received after the monthly revisions.
The digitized copies of all documents are provided by BOC and PEZA to PSA on a monthly basis through email.
The 2022 Philippine Standard Commodity Classification (PSCC) is used to classify the commodities at the most detailed 10-digit code level for statistical purposes.
SGD. WILMA A. PERANTE
Regional Director
| Attachment | Size |
|---|---|
|
|
1.69 MB |