

Release Date :
Reference Number :
202508-0800-33
 The total external trade in goods of Eastern Visayas in February 2025 was recorded at USD 225.04 million, posting a 50.8 percent decline from the USD 457. 01 million total trade registered in February 2024.
The total value of exports in February 2025 amounted to USD 1.62 million, down by 98.9 percent from the USD 145.38 million exports in February 2024. Meanwhile, total value of imports declined to USD 223.42 million in February 2025, which registered a 28.3 percent decrease from USD 311.63 million in February 2024.
The balance of trade in goods (BoT-G) in February 2025 recorded a deficit of USD 221.80 million, reflecting a wider trade gap compared to the USD 166.26 million deficit in the same month of 2024.
EXPORTS
 The total volume of goods exported by the region in February 2025 was recorded at 24.12 million kilograms, composing the bulk of the 113.58 million kilograms of exported goods in February 2024.
The commodity group of inorganic chemicals; organic or inorganic compounds of precious metals, of rare-earth metals, of radio-active comprised two-thirds (61.0 percent) of the total exports in February 2025, with sales amounting to USD 0.99 million. This was followed by the commodity group of residues and waste from the food industries; prepared animal fodder valued at USD 0.60 million or 37.1 percent of the region’s total exports in February 2025. Ores, slag and ash commodity group came next valued at USD 0.02 million or 1.2 percent of the region’s total exports. Lastly, the commodity group of pulp of wood or of other fibrous cellulosic material; recovered (waste and scrap) paper or paperboard contributed USD 0.01 million, representing 0.7 percent of the region’s total exports in February 2025 (Table 2).
India was the leading export destination in February 2025, with exports valued at USD 0.99 million, representing the bulk or 61.0 percent of the overall exports. The rest of the four export markets included People’s Republic of China with USD 0.60 million (37.1%), Malaysia with USD 0.02 million (1.2%), and Thailand with USD 0.01 million (0.7%) (Table 3).
IMPORTS
 The region imported a total of 191.84 million kilograms of goods in February 2025, reflecting a 10.3 percent decline from the 213.94 million kilograms of imported goods recorded in February 2024.
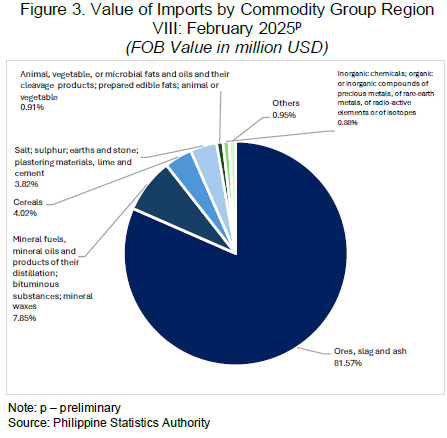
The commodity group of ores, slag and ash was the leading import commodity group, with a total value of USD 182.24 million, which represented 81.6 percent of the region’s overall value of imports in February 2025. This was followed by mineral fuels, mineral oils and products of their distillation; bituminous substances; mineral waxes, which amounted USD 17.54 million or 7.8 percent of the total value of imports. Salt; sulphur; earths and stone; plastering materials, lime and cement commodity group came next with imports valued at USD 8.54 million or 3.8 percent of the total imports in February 2025. Animal, vegetable, or microbial fats and oils and their cleavage products; prepared edible fats; animal or vegetable commodity group contributed 0.9 percent of the regions's total value of imports in February 2025. The commodity group of inorganic chemicals; organic or inorganic compounds of precious metals, of rare-earth metals, of radio-active elements or of isotopes worth USD 1.96 million accounted for 0.9 percent of the regions's total value of imports in February 2025. All the remaining commodity groups combined shared 2.13 percent to the region’s total imports for the month (Table 4).
Chile was recorded as the region’s top import source in February 2025, which contributed USD 52.07 million or 23.3 percent of the total value of imports. Completing the list of top five (5) import suppliers during the month were Australia, with imports valued at USD 43.65 million (19.5%); Papua New Guinea with USD 38.13 million (17.1%); Peru with USD 26.40 million (11.8%); and the People’s Republic of China with USD 21.02 million (9.4%) (Figure 3 and Table 5).


Technical Notes
Export and Import Trade Statistics are compiled by the Philippine Statistics Authority (PSA) from copies of export and import documents submitted to the Bureau of Customs (BOC) by exporters and importers or their authorized representatives as required by law. PSA collects copies of the following accomplished forms:
1. Export Declaration (ED – DTI form)
2. Import Entry & Internal Revenue Declaration (BOC IEIRD Form 236)
3. Informal Import Declaration and Entry (BOC Form 177)
4. Single Administrative Documents (SAD)
The output of the Automated Export Documentation System (AEDS) of the BOC is being utilized to generate export statistics. AEDS is a paperless transaction in lieu of the manual filling-up of export documents.
Moreover, an electronic copy of the IEIRD, or SAD, is utilized to capture the monthly import figures. SAD-IEIRD is an on-line submission of import documents either by brokers or companies. These are transactions that pass through the Automated Cargo Operating System (ACOS), now called the e2m (electronic to mobile) customs system, a system implemented through the BOC e-Customs Project.
All documents (hard copies and e-files) received before the cut-off date which is every 25th day of the month, are compiled, processed and generated in monthly statistical tables for the preparation of Press Release. All documents received after the cut-off date, however, are processed and included in the generation of the revised monthly statistical tables. Final data revisions are made annually during the first quarter after the reference year to include documents received after the monthly revisions.
The digitized copies of all documents are provided by BOC and PEZA to PSA on a monthly basis through email.
The 2022 Philippine Standard Commodity Classification (PSCC) is used to classify the commodities at the most detailed 10-digit code level for statistical purposes.
SGD. WILMA A. PERANTE
Regional Director
| Attachment | Size |
|---|---|
|
|
308.3 KB |