

Release Date :
Reference Number :
25SR08078-05
INFLATION RATE
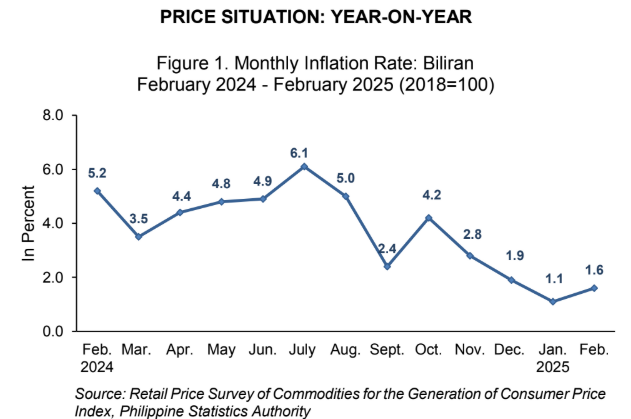
The inflation rate (IR) in Biliran Province increased to 1.6 percent in February 2025 which is higher by 0.5 percentage points than the recorded IR of 1.1 percent in January 2025. In February 2024, the IR was higher at 5.2 percent. (Figure 1)
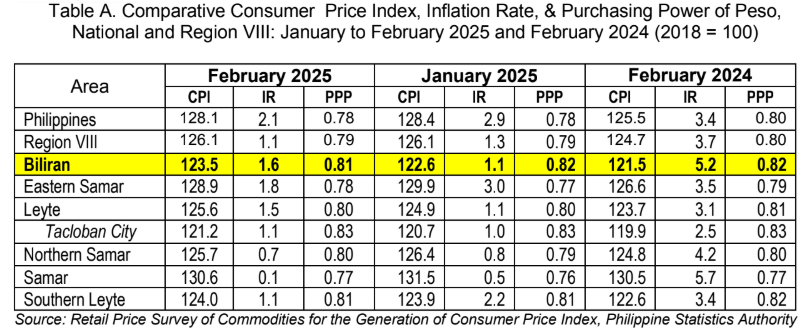
The provincial IR of 1.6 percent in February 2025 is lower by 0.5 percentage points than the national IR of 2.1 percent. In contrast, the provincial IR is higher by 0.5 percentage points than the regional IR of 1.1 percent. (Table A)
Among the six (6) provinces and the lone Highly Urbanized City (HUC) in Eastern Visayas, Biliran recorded the second highest inflation rate in February 2025. (Table A)
In February 2025, the province recorded an IR of 1.6 percent for all income households. This refers to All Items or the provincial market basket which represents the goods and services commonly purchased by households in Biliran. (Table A)
The uptrend in the province’s inflation in February 2025 was primarily influenced by food and non-alcoholic beverages with an annual increase of 0.1 percent from an annual decrease of 0.9 percent in January 2025. Housing, water, electricity, gas, and other fuels came in next with 2.1 percent during the month from 0.3 percent in the previous month. These commodity groups accounted for 62.2 percent and 37.8 percent share to the uptrend in the inflation rate in the province, respectively.
On the other hand, lower year-on-year price movements in February 2025 were observed in the following commodity groups:
a. Clothing and footwear at 6.0 percent from 6.4 percent;
b. Furnishings, household equipment and routine household maintenance at 6.4 percent from 6.6 percent;
c. Health at 3.4 percent from 3.5 percent;
d. Transport at 0.8 percent from 1.4 percent;
e. Recreation, sport and culture at 7.7 percent from 8.4 percent;
f. Restaurants and accommodation services at 2.9 percent from 3.6 percent; and
g. Personal care, and miscellaneous goods and services at 6.5 percent from 7.0 percent.
Meanwhile, the the rest of the commodity group retained their respective previous month’s annual rates. (Table 1)
Food inflation in the province recorded a slower annual decline of 0.4 percent in February 2025 from an annual decline of 1.5 percent in January 2025. The acceleration of food inflation rate in February 2025 was mainly influenced by fish and other seafood with a slower annual decrease of 0.8 percent during the month from 4.9 percent annual decrease in the previous month. This was followed by meat and other parts of slaughtered land animals with 8.2 percent during the month from 4.2 percent in the previous month. Fruits and nuts also contributed to the trend with 11.1 percent during the month from 5.0 percent in the previous month. (Table 1)
In addition, ready-made food and other food products not elsewhere classified (n.e.c) recorded 9.3 percent faster annual increase during the month from 8.9 percent in the previous month.
Rice, the central commodity of Filipinos, exhibited faster annual decrease in its inflation rate at 10.3 percent in February 2025 from an annual decrease of 9.1 percent in January 2025. The corn also recorded an faster annual decline of 5.2 percent from an annual decrease of 4.1 percent.
Meanwhile, lower food inflation rate was observed in the following food items:
a. Flour, bread and other bakery products, pasta products at 2.8 percent from 3.0 percent;
b. Milk, other dairy products and eggs at 4.3 percent from 4.8 percent;
c. Oils and fats at 3.3 percent from 4.3 percent;
d. Vegetables, tubers, plantains, cooking bananas and pulses at 8.5 percent from 9.0 percent; and
e. Sugar, confectionery and desserts at 0.1 percent from 1.3 percent.
The non-food category in general recorded faster growth of 3.2 percent during the month from 2.9 percent in the previous month. (Table 1)
CONSUMER PRICE INDEX
The Consumer Price Index (CPI) in February 2025 was recorded at 123.5 percent. This implies that the average level of prices of consumer food and services purchased by households in February 2025 was higher by 23.5 percent compared with the prices in 2018. (Table 2)
Moreover, the provincial CPI in February 2025 is lower by 2.6 percentage points and 4.6 percentage points than the regional and national CPI levels, respectively. (Table A)
Ten (10) of the 13 commodity groups observed increase in its CPI levels in February 2025. These groups are food and non-alcoholic beverages; alcoholic beverages and tobacco; clothing and footwear; housing, water, electricity, gas and other fuels; furnishings, household equipment and routine household maintenance; health; transport; information and communication; recreation, sport and culture; and personal care, and miscellaneous goods and services.
Meanwhile, the rest of the commodity groups retained its previous month’s CPI levels.
By commodity group, the financial services still posted the highest CPI level at 162.2 percent. This was followed by the transport group and the food and non-alcoholic beverages group with CPI levels of 129.8 percent and 126.8 percent, respectively. On the other hand, the information and communication group recorded the least CPI with 106.8 percent. (Table 2)
In general, the CPI of the food index increased to 126.5 percent during the month from 125.4 percent in the previous month.
During the month, the following food items observed higher CPI levels:
a. Rice at 110.0 percent from 109.5 percent;
b. Flour, bread and other bakery products, pasta products and other cereals at 119.7 percent from 119.5 percent;
c. Meat and other parts of slaughtered land animals at 149.4 percent from 145.2 percent;
d. Fish and other seafood at 128.5 percent from 126.7 percent;
e. Milk, other dairy products and eggs at 124.8 percent from 124.6 percent;
f. Oils and fats at 126.5 percent from 126.4 percent;
g. Fruits and nuts at 149.6 percent from 147.8 percent; and
h. Ready-made food and other food products n.e.c. at 134.7 percent from 133.5 percent.
In contrast, lower CPI levels were observed in vegetables, tubers, plantains, cooking bananas and pulses, and in sugar, confectionery and desserts at 143.8 percent and 144.0 percent from its previous CPI levels of 145.0 percent and 144.5 percent, respectively.
Meanwhile, only the corn retained its CPI level from the previous month at 124.4 percent.
The non-food category recorded higher CPI level at 120.5 percent in February 2025 from 119.7 percent in January 2025. (Table 2)
PURCHASING POWER OF PESO (PPP)
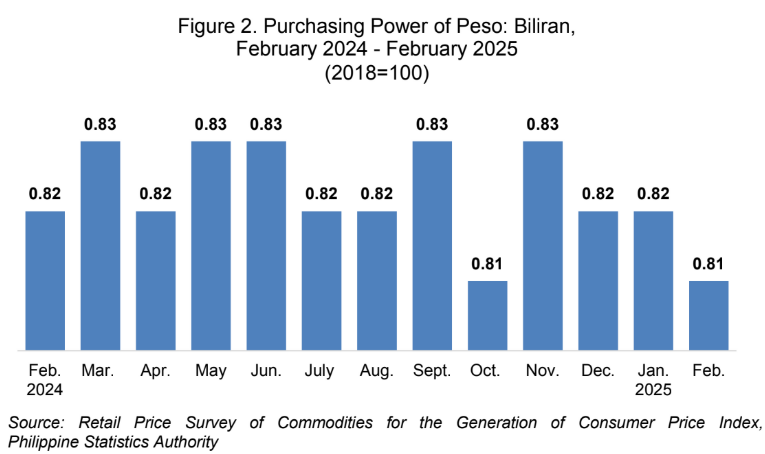
The price changes reflected in the CPI caused the value of the national currency in Biliran to have a value of Php 0.81. This PPP implies that the goods and services worth Php 1.00 in 2018 is now worth Php 0.81 in February 2025 or you will need Php 123.5 to buy the same goods and services worth Php 100 in 2018. (Table A and Figure 2)
Approved for release:
RENAVIL V. CUEVA
Chief Statistical Specialist
MMOCM/PDP
Annexes:
1. Table 1. Inflation Rate by Commodity Group, Biliran: January to February 2025 and February 2024 (2018=100)
2. Table 2. Consumer Price Index by Commodity Group, Biliran: January to February 2025 and February 2024
(2018=100)
3. Technical Notes
| Attachment | Size |
|---|---|
|
|
532.3 KB |