SPECIAL RELEASE
Northern Samar Increases 4.2 Percent Inflation Rate in July 2024
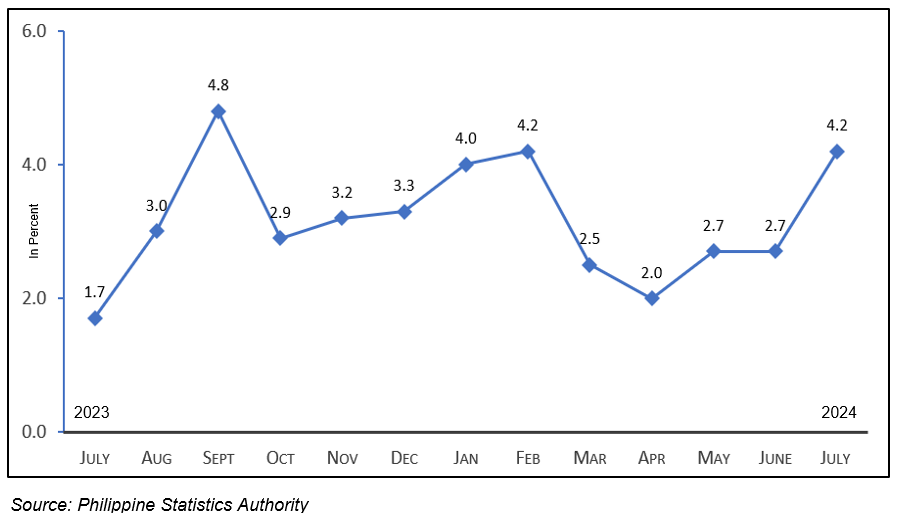
The inflation rate (IR) of Northern Samar increased its figure at 4.2 percent this July 2024 compared to 2.7 IR in June 2024. This month’s IR is 2.5 percentage point higher compared with the recorded 1.7 IR of the same period last year. While, the province’s IR is 0.2 percentage point lower than the Regional IR of 4.4 percent this month.
Figure 1. Monthly Inflation Rate Northern Samar:
July 2023 – July 2024
(2018=100)
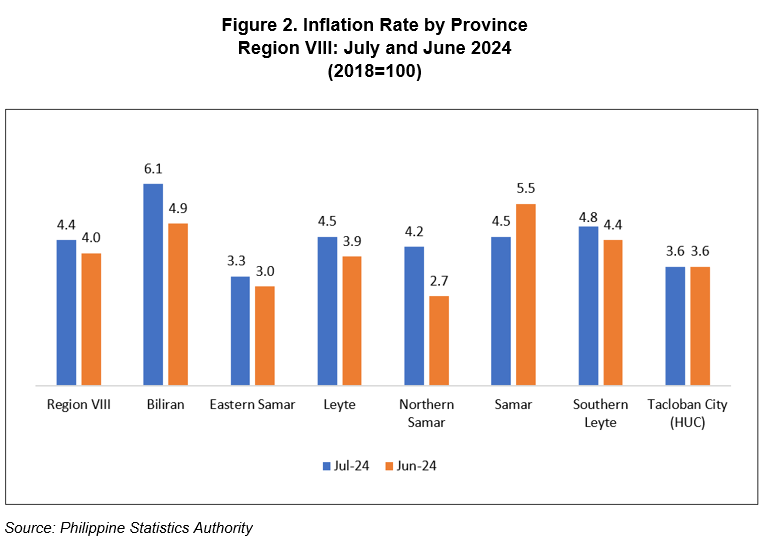
Five (5) out of six (6) provinces registered an increase in their IRs, one province posted a decrease in its IR, and one HUC retained the same rate as the previous month. The regional inflation rate posted an increase this month, rising from 4.0 percent to 4.4 percent in July 2024.
In Eastern Visayas, four (4) provinces recorded an increase in their inflation rates: Biliran, from 4.9 percent to 6.1 percent this month, representing a 1.2 percentage point increase; Eastern Samar, at 3.3 percent this month compared to 3.0 percent last month, a 0.3 percentage point increase; Leyte, with an inflation rate of 4.5 percent in July 2024, from 3.9 percent a month ago; Northern Samar, from 2.l7 percent last month to 4.2 percent this July 2024 and Southern Leyte, with an inflation rate of 4.8 percent this month compared to 4.4 percent in June 2024, a 0.4 percentage point increase.
Moreover, only the province of Samar posted a decrease in its inflation rate, from 5.5 percent in June 2024 to 4.5 percent this month, representing a 1 percentage point decrease. Tacloban City (HUC) retained its inflation rate at 3.6 percent, the same as the previous month.
BY COMMODITY
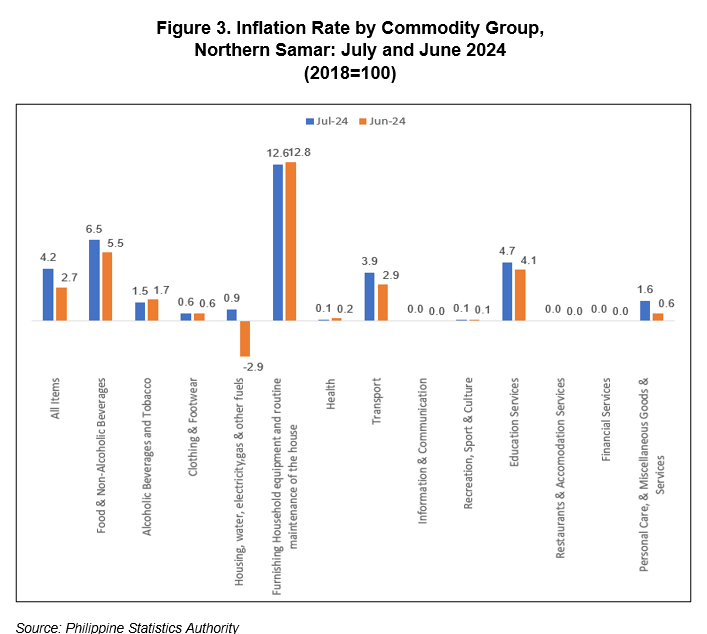
Out of thirteen (13) commodity groups in the province, five (5) commodity groups posted an increase in IRs, while three (3) commodity groups registered a lower IR during the month compared to their rates a month ago. Whereas, five (5) commodity groups retained their IRs. This resulted in the increase of figures for the overall IR.
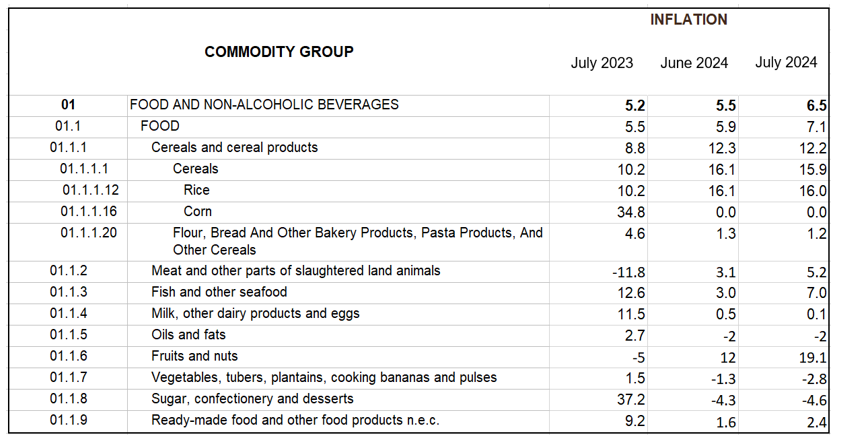
The increase in the province's inflation rate in July 2024 was mainly attributed to the food and non-alcoholic beverages category, which contributed 77.1 percent to July 2024 inflation for all items. The current inflation rate for this division is 6.5 percent, which represents an increase from 5.5 percent in June 2024 and 40.7 percent contribution to the trend of July 2024 inflation for all items.
The food sub-group increases an inflation rate (IR) of 7.1 percent in July 2024 compared to 5.9 percent in June 2024. This group represents a 76.1 percent
contribution to July inflation for all items.
For cereals and cereal products (ND), the sub-group posted a decrease in its inflation rate from 12.3 percent in June 2024 to 12.2 percent this month, with a 53.8 percent contribution to the overall June inflation.
Rice has also registered a decrease from 16.1 IR in June 2024 to a 16.0 IR for the month of June 2024. This represents a 52.7 percent contribution to June inflation for all items.
Flour, Bread and Other Bakery Products, Pasta Products, and Others posted a decrease from 1.3 percent IR in June 2024 to 1.2 percent this month that contributes 1.0 percent to June inflation.
While, Fish and other seafood displayed an increase of 4 percentage points with its current IR of 7.0 from a 3.0 IR. This corresponds to a 10.1 percent contribution to July
2024 inflation for all items.
The inflation rate for housing, water, electricity, gas, and other fuels increased in July 2024 at 0.9 percent from -2.9 percent in June 2024. This category represented a 4.1 percent contribution to July 2024 inflation for all items. Within this category, the inflation rate for gas increased from 15.8 percent in the previous month to 20.2 percent this month of July, contributing 4.8 percent to July inflation for all items.
The inflation rate for housing, water, electricity, gas, and other fuels increased in July 2024 at 0.9 percent from -2.9 percent in June 2024. This category represented a 4.1 percent contribution to July 2024 inflation for all items. Within this category, the inflation rate for gas increased from 15.8 percent in the previous month to 20.2 percent this month of July, contributing 4.8 percent to July inflation for all items.
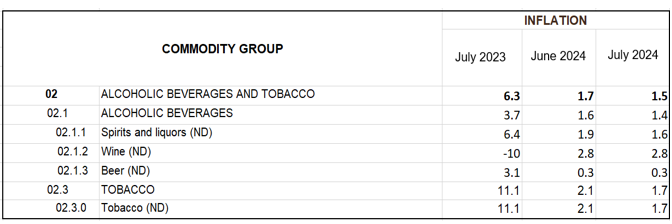
Alcoholic Beverages and Tobacco commodity group registered a decrease in IR from 1.7 percent in June 2024 to 1.5 percent in July 2024. That is, a 0.2 percentage point decrease, with a 0.9 percent contribution to July 2024 inflation for all items.
The other three (3) commodity groups registered an increase in their inflation rates: Transport, which increased from 2.9 percent in June 2024 to 3.9 percent this month, representing a 0.1 percentage point increase, Education Services, which increased from 4.1 percent in June 2024 to 4.7 this month and Personal Care, and Miscellaneous Goods and Services, which increased from 0.6 percent to 1.6 percent in July 2024.
While, two (2) commodity groups posted a decrease in IR, furnishings, household equipment and routine household maintenance decreases from 12.8 percent to 12.6 percent in July 2024, and health group posted a decrease in its inflation rate from 0.2 percent in June 2024 to 0.1 percent this month, representing a 0.1 percentage point decrease.
Moreover, the following commodities retained their inflation rates from the previous month:
a. Clothing and Footwear at 0.6 IR;
b. Information and Communication at 0.0 IR;
c. Recreation, Sport & Culture at 0.1 IR;
d. Restaurants and Accommodation Services at 0.0 IR; and
e. Financial Services at 0.0 IR;
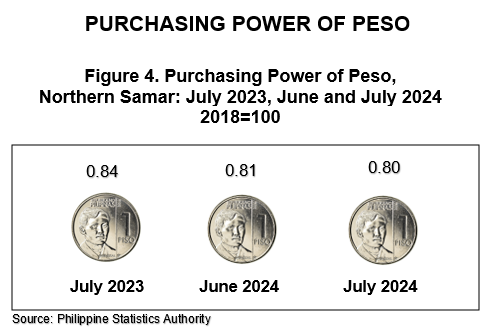
The Purchasing Power of Peso (PPP) in the province decreases at P0.80 for July 2024. This PPP indicates that P100.00 in 2018 is only worth P80.00 in July 2024. The PPP of the same month a year ago was P 0.04 higher at P 0.84 than this month’s PPP of P0.80.
Northern Samar’s PPP is the same as that of the Regional PPP of P 0.80. It ranked third among the provinces in Eastern Visayas from the highest PPP, tied with Eastern Samar.
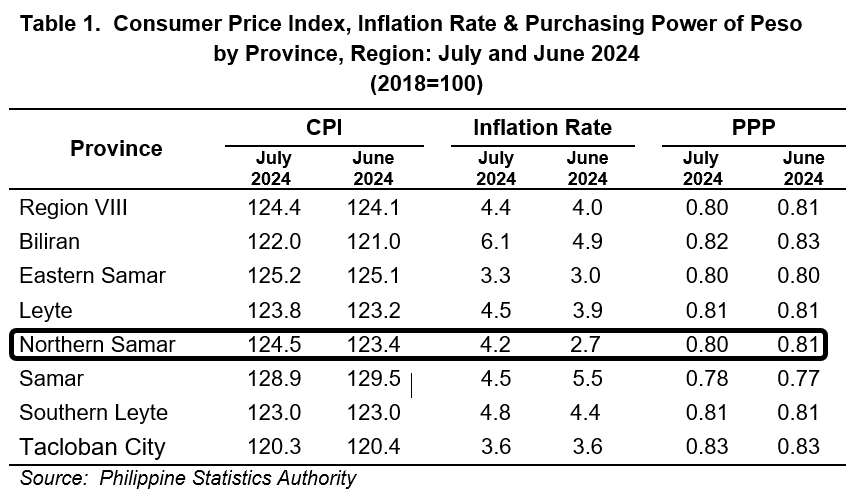
TABLE 2. Consumer Price Index by Subgroup, Month-on-Month and Year-on-Year
Percent Changes in Northern Samar
(2018=100)
TECHNICAL NOTES
Rebasing of the CPI is necessary to ensure that this barometer of economic phenomena is truly reflective of current situation. Consumer taste, fashion and technology change over time causing the fixed market basket of goods and services to become outmoded. To capture such changes for a more meaningful price comparison, revision or updating of the fixed market basket, the sample outlets, the weights and the base year had to be done periodically.
CONSUMER PRICE INDEX – is an indicator of the changes in the average retail price of a fixed market basket of goods and services commonly purchased by households relative to a base year.
USES OF CPI- it is most widely used in the calculation of the inflation rate and purchasing power of peso. It is a major statistical series used for economic analysis and as a monitoring indicator of government economic policy.
COMPUTATION OF CPI- the computation of the CPI involves consideration of the following important points:
A. BASE PERIOD – refers to the reference period of the index number. It is a period at which the index is set to 100. Current base period is 2018.
B. MARKET BASKET - refers to a sample of goods and services used to represent all goods and services
C. WEIGHTING SYSTEM- uses the expenditures on various consumer items purchased by households as a proportion to total expenditures.
D. FORMULA- the formula used in computing the CPI is the weighted arithmetic mean of price relatives, the Laspeyre’s formula with a fixed base year period (2018) weights.
E. GEOGRAPHIC COVERAGE- CPI values are computed at the national, regional, and provincial levels, and for selected cities.
RETAIL PRICE - refers to the actual price at which retailers sell a commodity on spot or earliest delivery, usually in small quantities for consumption and not for resale. It is confined to transactions on cash basis in the free market and excludes black-market prices and prices of commodities that are on sale as in summer sals, anniversary sales, Christmas sales, etc.
INFLATION RATE – refers to the rate of change of the CPI expressed in percent. Inflation is interpreted in terms of declining purchasing power of peso.
PURCHASING POWER PESO – it is a measure of how much the peso in the base period is worth in another period. It gives as indication of the real value in a given period relative to the peso value in the base period.
(SGD) MARIA THERESA G. ELIZALDE
(Supervising Statistical Specialist)
Officer-in-Charge

