

Release Date :
Reference Number :
24SR0837-051
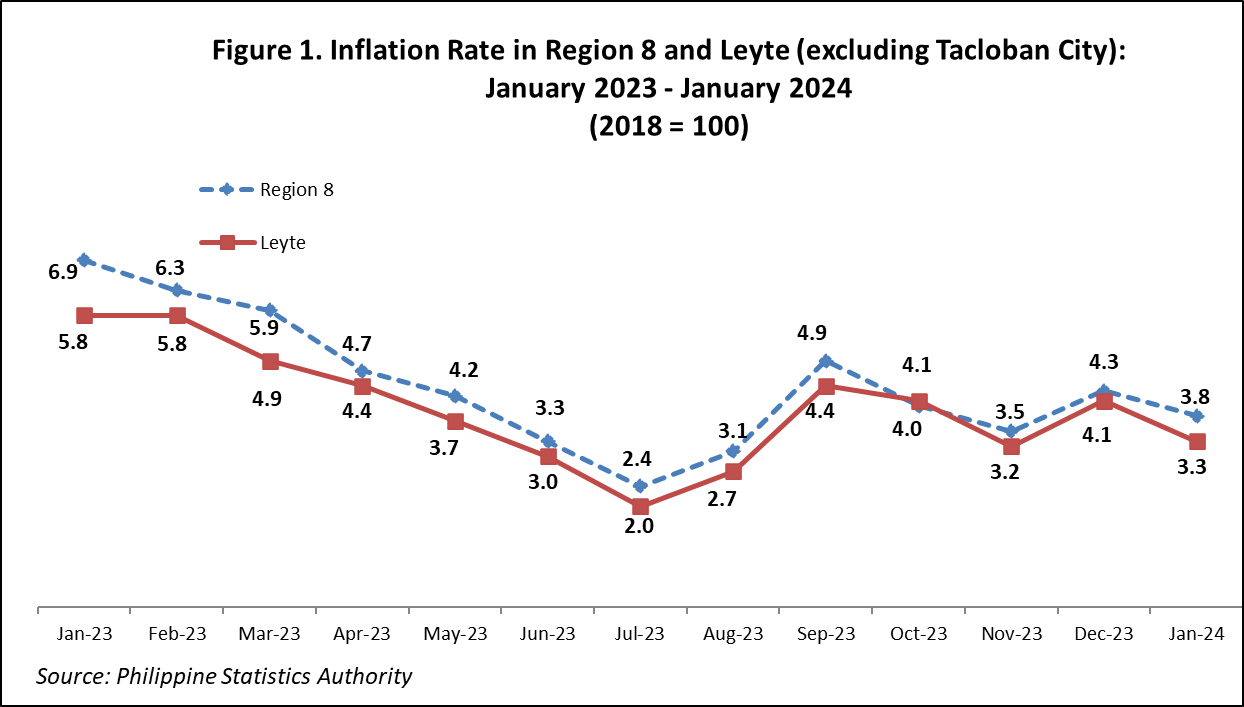
Leyte's inflation rate slows down at 3.3 percent in January 2024
Leyte’s inflation rate decelerated at 3.3 percent in January 2024 from 4.1 percent in December 2023. In January 2023, inflation rate was higher at 5.8 percent. Likewise, the region’s inflation rate slowed down at 3.8 percent in January 2024 from 4.3 percent in December 2023. Among the provinces and HUC in the region, only Northern Samar, Southern Leyte, and Biliran recorded an increase in their respective inflation rate in January 2024.
Main Drivers to the Downward Trend of Leyte’s Inflation
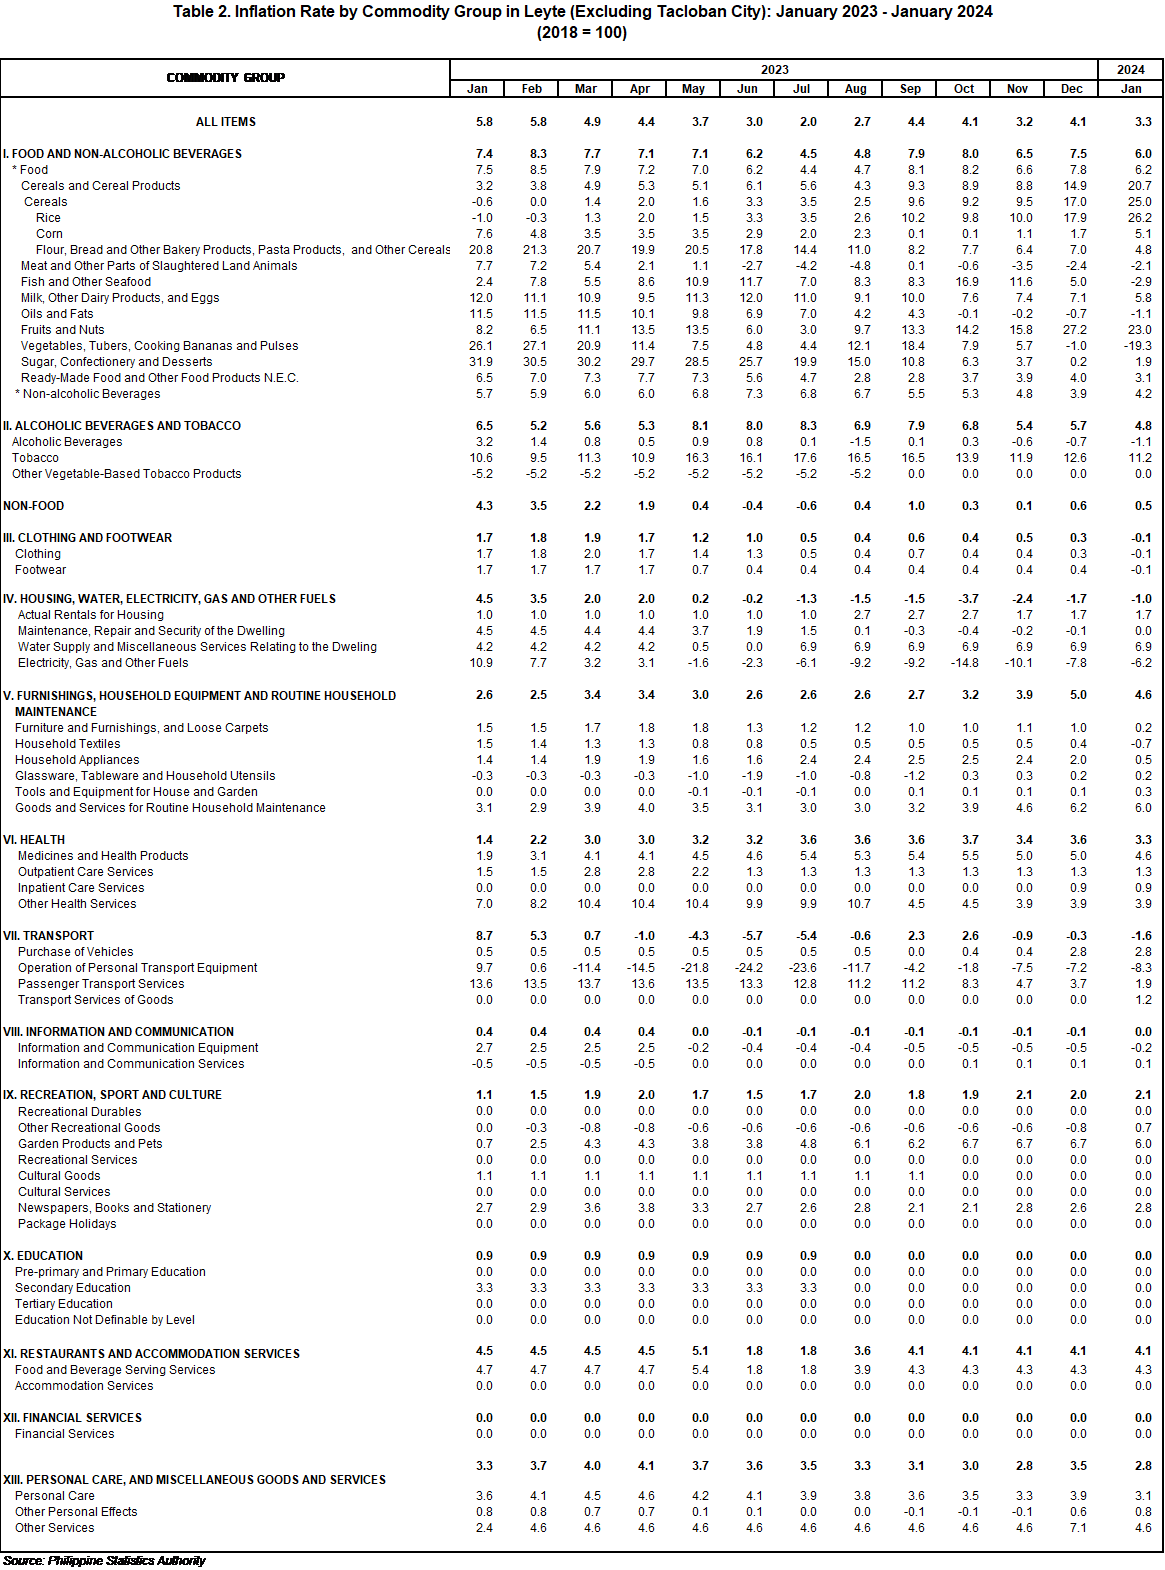
The downtrend in Leyte’s inflation in January 2024 was primarily brought about by the slower annual increment of food and non-alcoholic beverages at 6.0 percent in January 2024 from 7.5 percent in the previous month which was driven by the slower rate of increase in prices of milk, other dairy products and eggs, fruits and nuts, ready-made food and other food products n.e.c., fruit and vegetable juices, soft drinks, and other non-alcoholic beverages, the decrease in prices of fish and other seafood, and the faster rate of decrease in prices of oils and fats and vegetables, tubers, plantains, cooking bananas and pulses. Lower annual increments were also noted in the indices of the following commodity groups during the month:
a. Alcoholic beverages and tobacco at 4.8 percent from 5.7 percent due to the slower rate of increase in prices of tobacco and the decrease in prices of wine;
b. Furnishings, household equipment and routine household maintenance at 4.6 percent from 5.0 percent which was driven by the slower rate of increase in prices of furniture, furnishings and loose carpets, major household appliances, whether electric or not, small household appliances, and domestic services and household services, and the decrease in prices of household textiles;
c. Health at 3.3 percent from 3.6 percent which was caused by the slower rate of increase in prices of medicines and medical products; and
d. Personal care, and miscellaneous goods and services at 2.8 percent from 3.5 percent due to the slower rate of increase in prices of other appliances, articles and products for personal care, hairdressing salons and personal grooming establishments, and other services.
In addition, clothing and footwear recorded a deflation of -0.1 percent during the month from an inflation of 0.3 percent in December 2023 which was caused by the decrease in prices of garments and shoes and footwear, and the slower rate of increase in prices of other articles of clothing and clothing accessories and cleaning, repair, tailoring and hire of clothing. Moreover, transport further recorded a deflation of -1.6 percent in January 2024 from a deflation of -0.3 percent in the previous month due to the faster rate of decrease in prices of fuels and lubricants for personal transport equipment, the decrease in prices of passenger transport by air, and the slower rate of increase in prices of passenger transport by road.
In contrast, recreation, sport and culture recorded a slightly higher inflation of 2.1 percent in January 2024 from 2.0 percent in the previous month due to the increase in prices of games, toys and hobbies and the faster rate of increase in prices of stationery and drawing materials. Further, information and communication recorded an inflation of zero percent during the month from a deflation of 0.1 percent in December 2023 which was caused by the slower rate of decrease in prices of information processing equipment and unrecorded recording media. Moreover, housing, water, electricity, gas and other fuels recorded a deflation of -1.0 percent in January 2024 from a deflation of 1.7 percent in the previous month due to the slower rate of decrease in prices of security equipment and materials for the maintenance and repair of the dwelling and electricity, the increase in prices of liquid fuels, and the faster rate of increase in prices of gas.
Meanwhile, the three (3) other major commodity groups maintained their inflation rates from their previous months’ rate:
a. Education services at zero percent;
b. Restaurants and accommodation services at 4.1 percent; and
c. Financial services at zero percent.
The top three commodity groups contributing to the January 2024 inflation of Leyte were the following:
a. Food and non-alcoholic beverages with 87.9 percent share or 2.90 percentage points;
b. Restaurants and accommodation services with 6.4 percentage share or 0.21 percentage point; and
c. Furnishings, household equipment and routine household maintenance with 5.0 percent share or 0.16 percentage point.
The inflation rate is the general rise in prices over a period. It indicates how fast or how slow price changes over two-time periods. Contrary to common knowledge, low inflation does not necessarily connote that prices are falling instead; it means that prices continue to increase at a slower rate. It is a derived indicator of the Consumer Price Index (CPI).
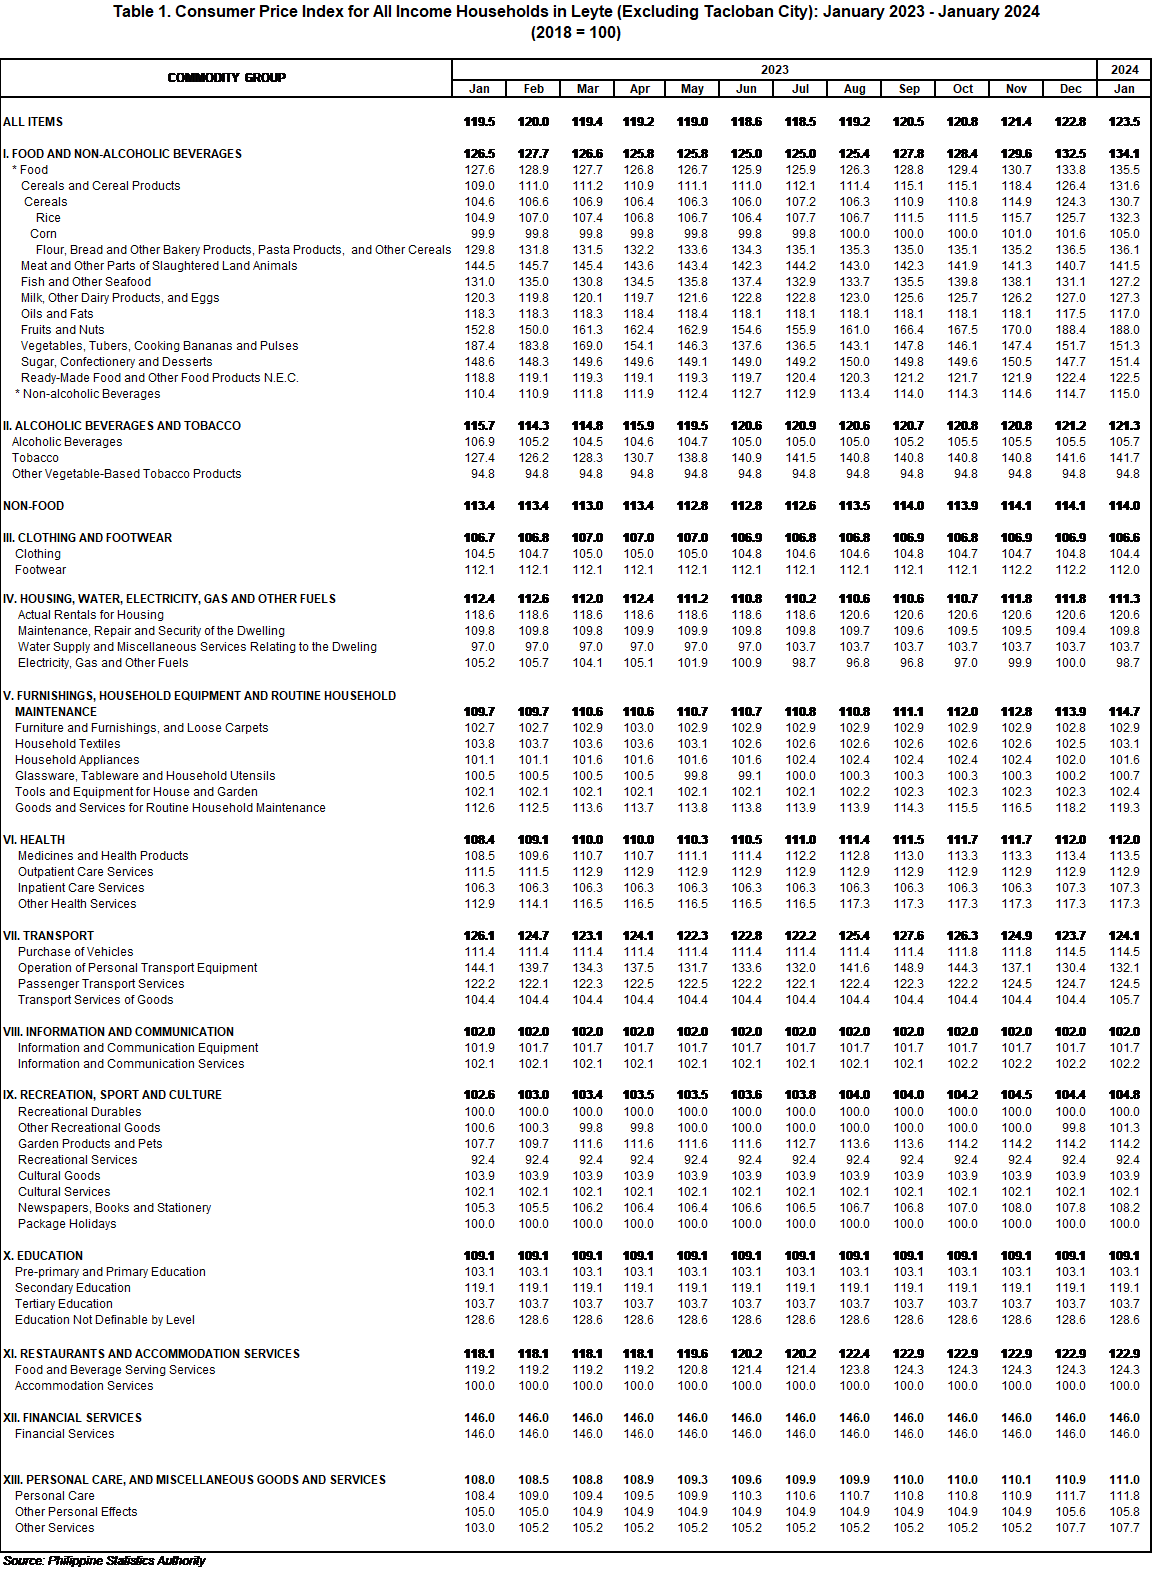
The CPI is a measure of change in the average retail prices of goods and services commonly purchased by a particular group of people in a specific area. The overall CPI in Leyte for January 2024 was 123.5. This implies that the average retail price of goods and services in Leyte is 23.5 percent higher than the average retail prices in 2018 (base year).
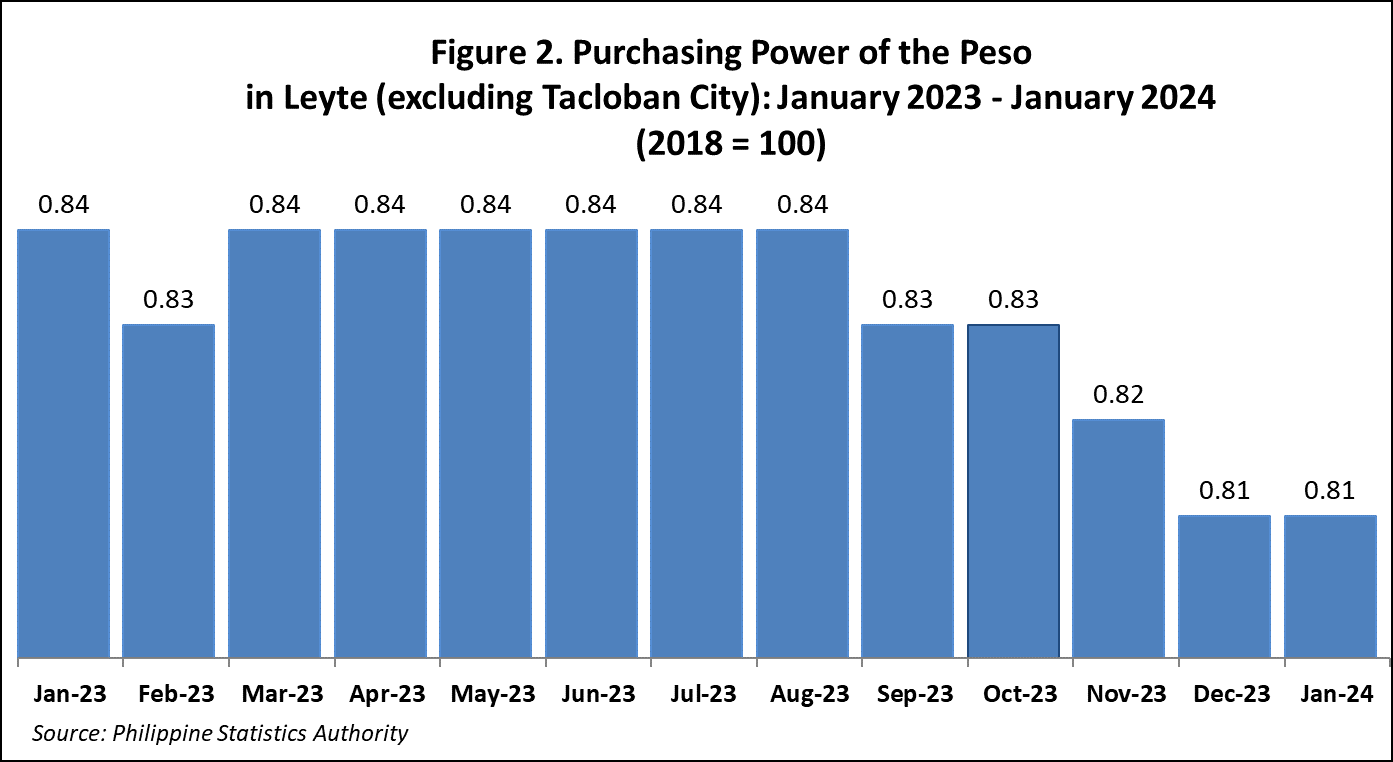
Purchasing Power of Peso (PPP) retains at 81 centavos in January 2024
The Purchasing Power of Peso (PPP) in Leyte retained at 81 centavos in January 2024. Meanwhile, the PPP in the region declined at 80 centavos in January 2024 from 81 centavos in December 2023. The 81 centavos purchasing power of peso in Leyte indicates that the same basket of goods and services worth 81 pesos in 2018 (base year) is worth 100 pesos during the reference period.
TECHNICAL NOTES
Rebasing of the CPI is necessary to ensure that this barometer of economic phenomena is truly reflective of current situation. Consumer taste, fashion and technology change over time causing the fixed market basket of goods and services to become outmoded. To capture such changes for a more meaningful price comparison, revision or updating of the fixed market basket, the sample outlets, the weights and the base year had to be done periodically.
BASE PERIOD – refers to the reference period of the index number. It is a period at which the index is set to 100. Current base period is 2018.
COMPUTING THE CPI - The formula used in computing the CPI is the weighted arithmetic mean of price relatives, a variant of the Laspeyres formula with fixed base year period weights.
CONSUMER PRICE INDEX – is a measure of change in the average retail prices of goods and services commonly purchased by a particular group of people in a particular area.
INFLATION RATE – refers to the annual rate of change or year-on-year change in CPI.
MARKET BASKET - refers to a sample of goods and services used to represent all goods and services bought by a particular group of consumers in a particular area.
MONITORING OF PRICES - is to establish baseline information for prices of the items in the base year and monitoring of the prices of the items on a regular basis. Except for Food, Beverage and Tobacco which is monitored on a weekly basis in NCR, price collection is done twice a month. First collection phase is done during the first five days of the month while the second phase is on the 15th to 17th day of the month.
PURCHASING POWER PESO – it is a measure of how much the peso in the base period is worth in another period. It gives as indication of the real value in a given period relative to the peso value in the base period.
RETAIL PRICE - refers to the actual price at which retailers sell a commodity on spot or earliest delivery, usually in small quantities for consumption and not for resale. It is confined to transactions on cash basis in the free market and excludes black-market prices and prices of commodities that are on sale as in summer sales, anniversary sales, Christmas sales, etc.
WEIGHTS - The weights for the 2018-based CPI were derived from the expenditure data of the 2018 Family Income and Expenditure Survey (FIES). The weight for each item of expenditure is a proportion of that expenditure item to the total national expenditure. The total (all items) national expenditure weights is equal to 100.
SGD. SHERYL ANN A. JAMISOLA
Chief Statistical Specialist
| Attachment | Size |
|---|---|
|
|
414.32 KB |