

Release Date :
Reference Number :
SR-202306-0800-18
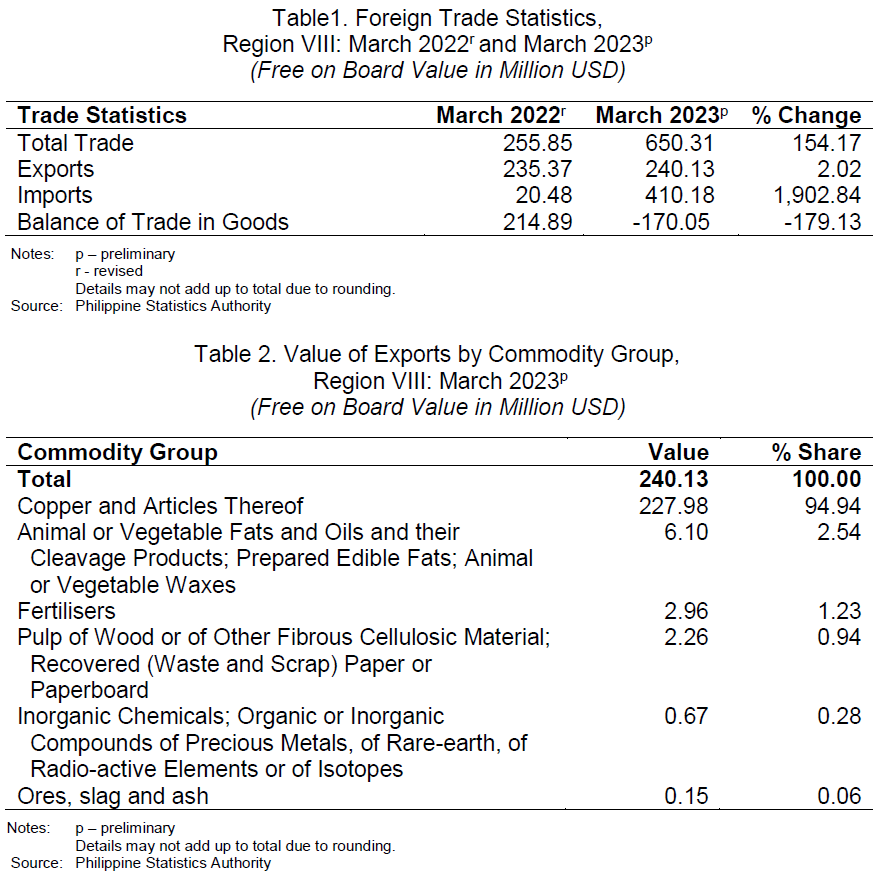
The total trade in goods in Eastern Visayas surged to USD 650.31 million in March 2023. This indicated an annual increase of 154.17 percent from the USD 255.85 million total trade in March 2022.
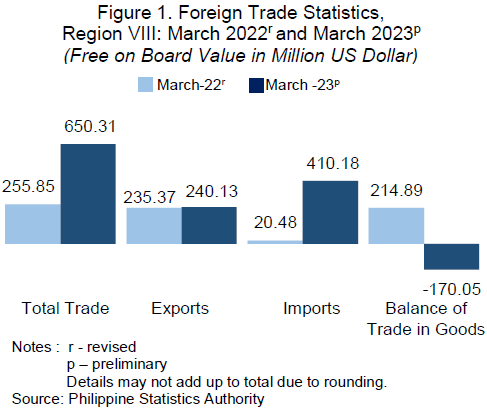
The balance of trade in goods (BoT-G), however, dived to USD -170.05 million in March 2023 from USD 214.89 million trade surplus in March 2022.
The total value of imports hit USD 410.18 million in March 2023 which reflected a 20-fold increase from the USD 20.48 million import in March 2022. The total value of exports increased slightly (2.02%) to USD 240.13 million in March 2023, fromUSD 235.37 million in March 2022 (Table 1).
EXPORTS
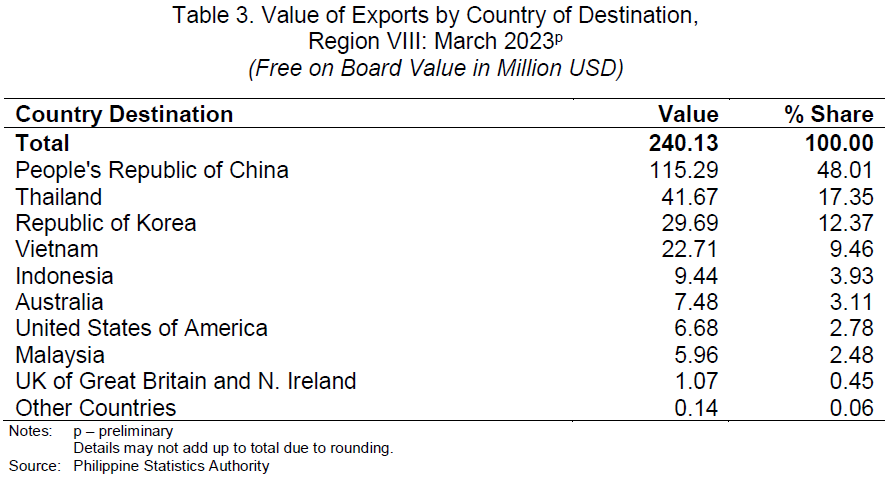
The total volume of goods exported by the region in March 2023 was 114.49 million kilograms with a total value of USD 240.13 million.
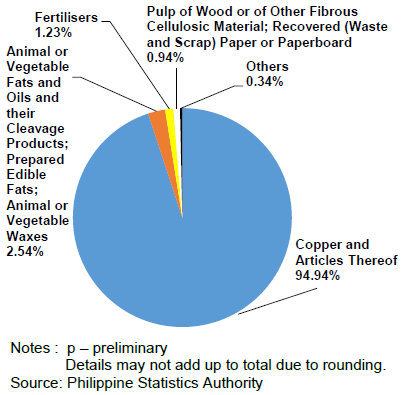
The bulk or 94.94 percent of Eastern Visayas’ export earnings in March 2023 was composed of copper and articles thereof commodity group worth USD 227.98 million. The commodity group of animal or vegetable fats and oils and their cleavage products; prepared edible fats; animal or vegetable waxes contributed USD 6.10 million or 2.54 percent of the total export value. Fertilisers shared 1.23 percent or USD 2.96 million, while other commodity groups contributed less than one percent each to the region’s total value of exports in March 2023 (Table 2).
Export sales from People’s Republic of China accounted for almost half (48.01%) of the total value of exports in March 2023 valued at USD 115.29 million. This was followed by exports to Thailand and Republic of Korea worth USD 41.67 (17.35%) and USD 29.69 (12.37%), respectively. Completing the top five major export destinations with their export values and percent shares to the total exports were Vietnam (USD 22.71 million, 9.46%); and Indonesia (USD 9.44 million, 3.93%).
IMPORTS
The volume of goods imported by the region in March 2023 was 216.55 million kilograms with a total value of USD 410.18 million.
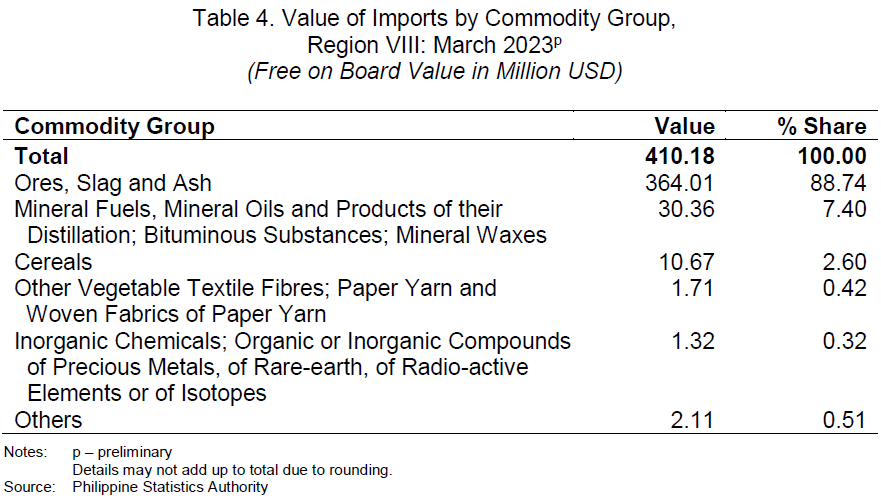
The commodity group of ores, slag and ash worth USD 364.01 million accounted the bulk or 88.74 percent of the total value of imported goods in March 2023. This was followed by the commodity group of mineral fuels, mineral oils and products of their distillation; bituminous substances; mineral waxes , worth USD 30.36 million which consisted 7.40 percent of the total value of imports. Imported cereals commodity group worth USD 10.67 million was 2.60 percent of the total value of imports during the month in review. Other commodity groups shared less than one percent to the total import value in March 2023 (Table 4).
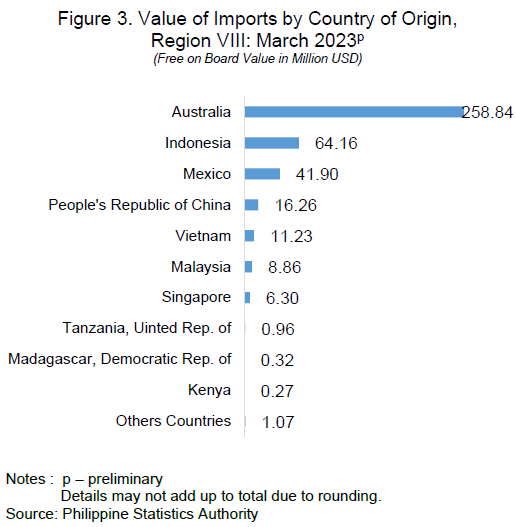
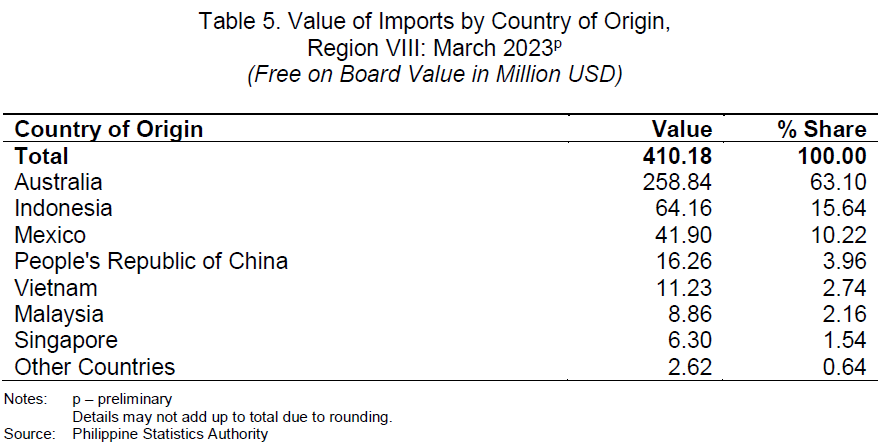
Australia was the region’s top supplier of imported goods worth USD 258.84 million contributing almost two-thirds (63.10%) of the total value of imports in March 2023. Indonesia followed with USD 64.16 million or 15.64 percent share to the total value of imports during the month. The rest of the top five import suppliers with their import values and percent shares to the total imports were Mexico
(USD 41.90 million, 10.22%); People’s Republic of China (USD 16.26 million, 3.96%); and Vietnam (USD 11.23 million, 2.74%) (Table 5).
TECHNICAL NOTES
Export and Import Trade Statistics are compiled by the Philippine Statistics Authority (PSA) from copies of export and import documents submitted to the Bureau of Customs (BOC) by exporters and importers or their authorized representatives as required by law. PSA collects copies of the following accomplished forms:
- Export Declaration (ED – DTI form)
- Import Entry & Internal Revenue Declaration (BOC IEIRD Form 236)
- Informal Import Declaration and Entry (BOC Form 177)
- Single Administrative Documents (SAD)
The output of the Automated Export Documentation System (AEDS) of the BOC is being utilized to generate export statistics. AEDS is a paperless transaction in lieu of the manual filling-up of export documents.
Moreover, an electronic copy of the IEIRD, or SAD, is utilized to capture the monthly import figures. SAD-IEIRD is an on-line submission of import documents either by brokers or companies. These are transactions that pass through the Automated Cargo Operating System (ACOS), now called the e2m (electronic to mobile) customs system, a system implemented through the BOC e-Customs Project.
All documents (hard copies and e-files) received before the cut-off date which is every 25th day of the month, are compiled, processed and generated in monthly statistical tables for the preparation of Press Release. All documents received after the cut-off date, however, are processed and included in the generation of the revised monthly statistical tables. Final data revisions are made annually during the first quarter after the reference year to include documents received after the monthly revisions.
The digitized copies of all documents are provided by BOC and PEZA to PSA on a monthly basis through email.
The 2019 Philippine Standard Commodity Classification (PSCC) is used to classify the commodities at the most detailed 10-digit code level for statistical purposes.
SGD. WILMA A. PERANTE
Regional Director
| Attachment | Size |
|---|---|
|
|
1.05 MB |