

Release Date :
Reference Number :
SR-2024-0800-22
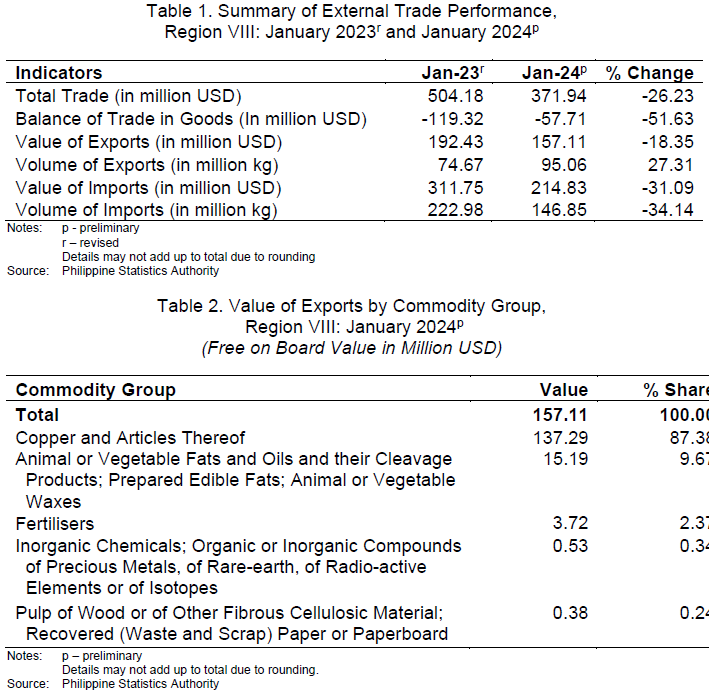
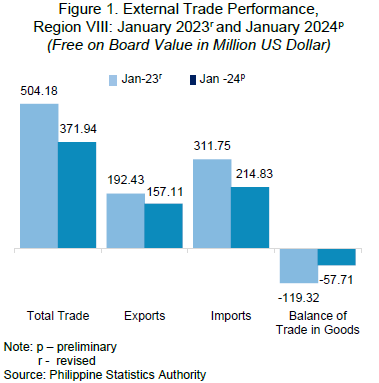 The region’s total external trade in goods in January 2024 amounted to USD 371.94 million. This indicated a 26.23 percent annual decline from the USD 504.18 million total trade in January 2023.
A deficit in the balance of trade in goods (BoT-G) was recorded in January 2024 at USD 57.71 million. This narrowed trade deficit by 51.63 percent from the USD 119.32 million trade deficit reported in January 2023.
The total value of exports, which stood at USD 157.11 million in January 2024, posted an 18.35 percent decline from the USD 192.43 million value of exports in January 2023. Likewise, total value of imports in January 2024, which amounted to USD 214.83 million, posted a 31.09 percent decline from USD 311.75 million value of imports in January 2023.
EXPORTS
The total volume of goods exported by the region in January 2024 was 95.06 million kilograms with a total value of USD 157.11 million.
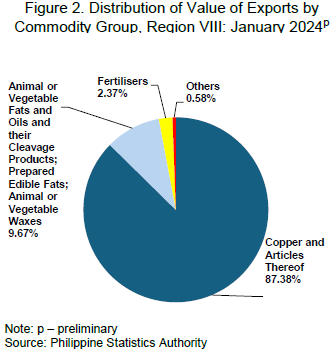
Copper and articles thereof commodity group dominated the market with exports worth USD 137.29 million. This comprised 87.38 percent of the total value of exports during the month. The commodity group of animal or vegetable fats and oils, and their cleavage products; prepared edible fats; animal or vegetable waxes valued at USD 15.19 million contributed 9.67 percent to the region’s total exports in January 2024. Fertilisers commodity group worth USD 3.72 million was 2.37 percent of the region’s total exports, while other commodity groups contributed less than one percent to the region’s total exports in January 2024 (Table 2).
The top export destination was Thailand with USD 33.28 million worth of exports or 21.18 percent of the total value of exports in January 2024. This was followed by the People’s Republic of China with USD 28.16 million (17.92%); Indonesia with USD 24.06 million (15.32%); Vietnam with USD 22.16 million (14.11%); and Republic of Korea (South Korea) with USD 22.02 million (14.01%) (Table 3).
IMPORTS
The total volume of goods imported by the region in January 2024 which weighed 146.85 million kilograms was worth USD 214.83 million.
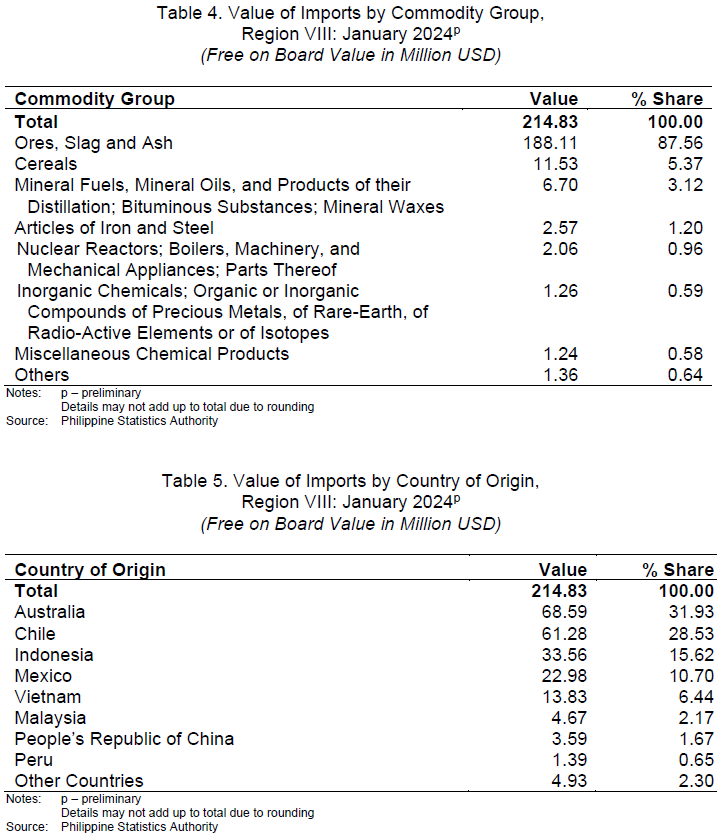
Ores, slag, and ash commodity group was the region’s major import in January 2024. This commodity group comprised the bulk or 87.56 percent of the total value of imports of the region at USD 188.11 million. Whereas, imported cereals worth USD 11.53 million contributed 5.37 percent to the regions's total value of imports in January 2024. Mineral fuels, mineral oils, and products of their distillation; bituminous substances; mineral waxes commodity group worth USD 6.70 million consisted 3.12 percent, while articles of iron and steel commodity group valued at USD 2.57 million accounted for 1.20 percent of the region’s total imports during the period. Other commodity groups contributed less than one percent to the total value of imports in January 2024 (Table 4).
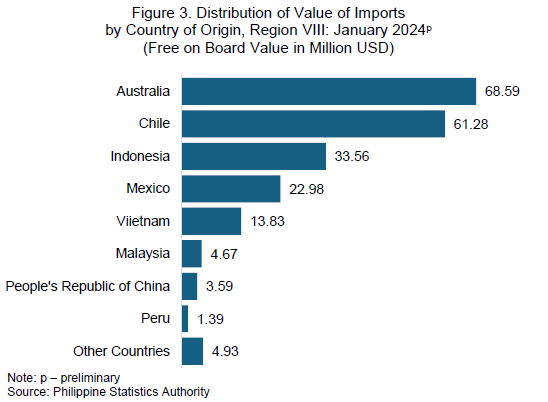
Australia, the top import supplier accounted for USD 68.59 million or 31.93 percent of the total value of imports in January 2024. This was followed by Chile with USD 61.28 million (28.53%); Indonesia with USD 33.56 million (15.62%); Mexico with USD 22.98 million (10.70%) and Vietnam with USD 13.83 million (6.44%) (Figure 3 and Table 5).

Technical Notes
Export and Import Trade Statistics are compiled by the Philippine Statistics Authority (PSA) from copies of export and import documents submitted to the Bureau of Customs (BOC) by exporters and importers or their authorized representatives as required by law. PSA collects copies of the following accomplished forms:
Export Declaration (ED – DTI form)
Import Entry & Internal Revenue Declaration (BOC IEIRD Form 236)
Informal Import Declaration and Entry (BOC Form 177)
Single Administrative Documents (SAD)
The output of the Automated Export Documentation System (AEDS) of the BOC is being utilized to generate export statistics. AEDS is a paperless transaction in lieu of the manual filling-up of export documents.
Moreover, an electronic copy of the IEIRD, or SAD, is utilized to capture the monthly import figures. SAD-IEIRD is an on-line submission of import documents either by brokers or companies. These are transactions that pass through the Automated Cargo Operating System (ACOS), now called the e2m (electronic to mobile) customs system, a system implemented through the BOC e-Customs Project.
All documents (hard copies and e-files) received before the cut-off date which is every 25th day of the month, are compiled, processed and generated in monthly statistical tables for the preparation of Press Release. All documents received after the cut-off date, however, are processed and included in the generation of the revised monthly statistical tables. Final data revisions are made annually during the first quarter after the reference year to include documents received after the monthly revisions.
The digitized copies of all documents are provided by BOC and PEZA to PSA on a monthly basis through email.
The 2019 Philippine Standard Commodity Classification (PSCC) is used to classify the commodities at the most detailed 10-digit code level for statistical purposes.
SGD. WILMA A. PERANTE
Regional Director
| Attachment | Size |
|---|---|
|
|
1.03 MB |