

Release Date :
Reference Number :
202504-0860-005
Samar’s inflation rate further slows to -0.2% in March 2025

Samar’s inflation rate has further slowed to negative 0.2 percent, down from 0.1 percent in February 2025. This shows a 3.6-percentage point decrease compared to the same month last year. Year-to-date province’s inflation rate stands at 0.1 percent, which is 1.0 percentage points lower than the regional average.
Top Three Commodity Groups Driving Samar’s Inflation Rate’s Deceleration
The slowdown in the province’s inflation rate was mainly driven by decelerations in the following major commodity groups:
a. Food and Non-alcoholic Beverages, which accounted for 92.5 percent, recorded a negative 2.1 inflation rate, lower by negative 0.9 percent from the previous month. This decrease was driven by the slower increase in the Food Sub-Commodity Group.
b. Transport, which contributed 5.1 percent, recorded an inflation rate of 2.9 percent, down from 3.4 percent in the previous month. This decline was mainly due to the slower increase in prices of Operation of Personal Transport Equipment.
c. Personal Care, and Miscellaneous Goods and Services, with a 1.4 percent share, registered an inflation rate of 0.9 percent, easing from 1.1 percent in the previous month. The slowdown was primarily driven by the slower increase in prices of Personal Care.
Meanwhile, five commodity groups recorded no change in their inflation rate:
1. Education Services, 7.7 percent;
2. Recreation, Sport and Culture, 1.4 percent;
3. Restaurants and Accommodation Services, 1.0 percent;
4. Information and Communication, 0.2 percent;
5. Financial Services, 0.0 percent
On the other hand, three commodity groups observed an upward trend namely: Alcoholic Beverages and Tobacco (7.1%); Health (2.8%); Housing, Water, Electricity, Gas and Other Fuels (1.1%).
The inflation rate refers to the overall increase in prices over a specific period. It reflects the speed at which prices change between two time periods. Contrary to popular belief, low inflation does not necessarily mean that prices are decreasing; rather, it indicates that prices are still rising but a slower pace. This rate is derived from Consumer Price Index (CPI).
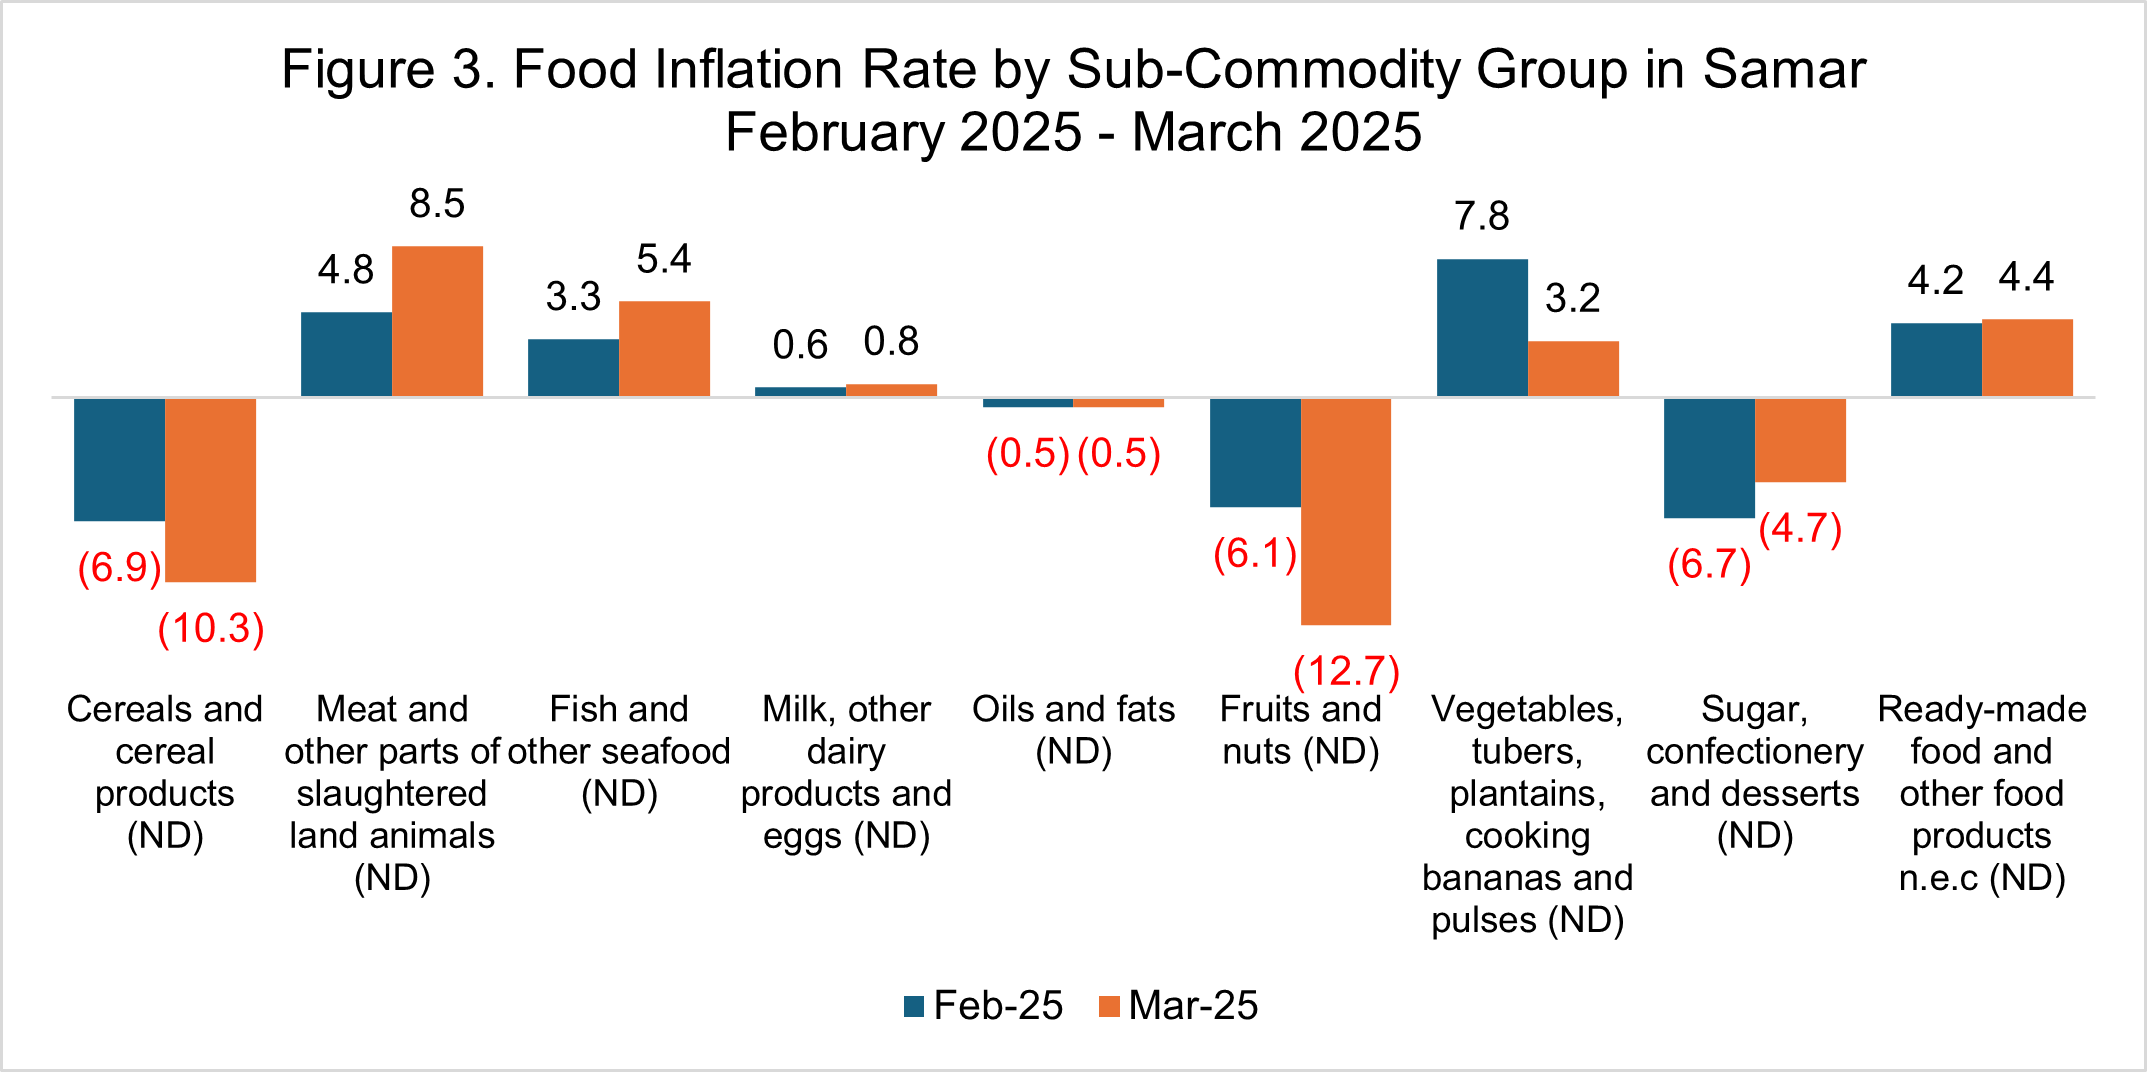
Food Inflation
The inflation rate for food further slowed down to negative 2.4 percent in March 2025, down from the negative 1.1 inflation rate in the previous month. Compared to the same month last year, Food inflation was recorded at 8.8 percent.
Main Drivers of the Downward Trend in Food Inflation
The downward trend in Food Inflation in March 2025 was primarily driven by a slower increase in Cereals and Cereal Products, from negative 6.9 percent in February 2025 to negative 10.3 percent in March 2025. Additionally, the inflation rates for Vegetables, Tubers, Plantains, and Cooking Bananas and Pulses and Fruits and Nuts slowed down to 3.2 percent and negative 12.7 percent, respectively.
Meanwhile, the following sub-commodity groups showed accelerated inflation rates in March 2025 compared to the previous month:
- Meat and Other Parts of Slaughtered Land Animals, from 4.8 percent to 8.5 percent;
- Fish and Other Seafood, from 3.3 percent to 5.4 percent;
- Milk, Other Dairy Products and Eggs, from 0.6 percent to 0.8 percent;
- Ready-made Food and other Food Products, from 4.2 percent to 4.4 percent;
- Sugar, Confectionery and Desserts, from negative 6.7 percent to negative 4.7 percent
Source: Philippine Statistics Authority, Retail Price Survey of Commodities for the Generation of Consumer Price Index
*Year-on-year changes of average CPI for March 2024 vs March 2025
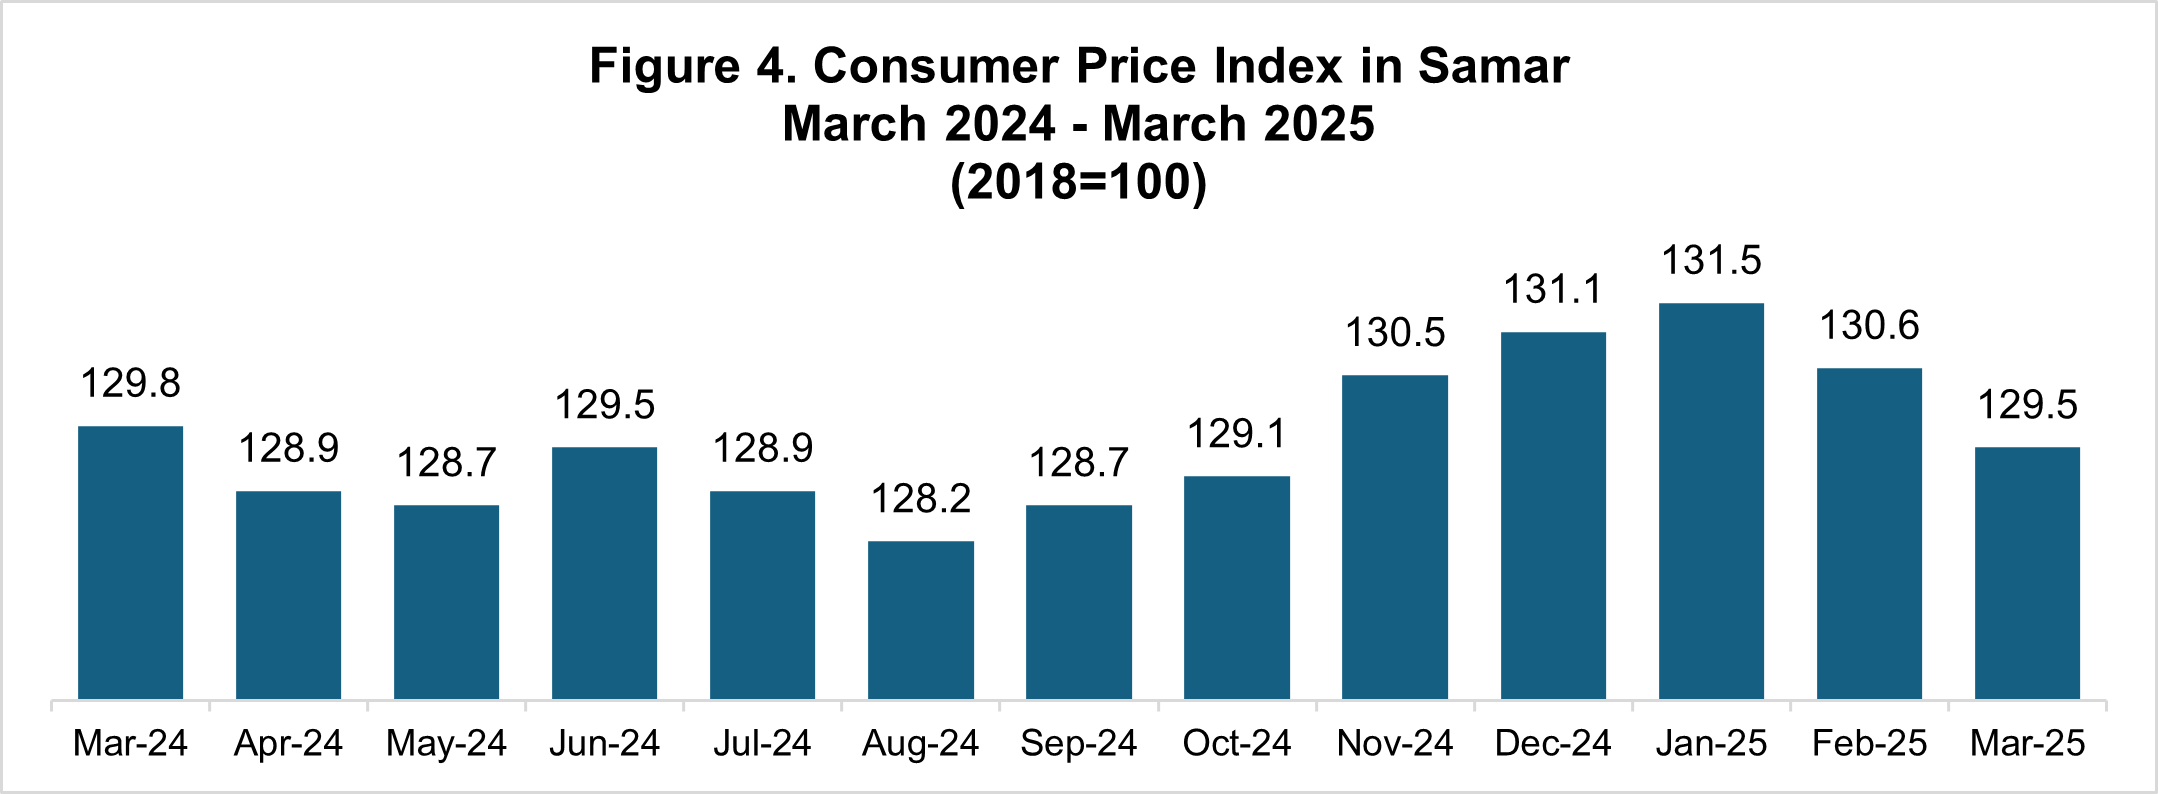
Consumer Price Index
In March 2025, the Consumer Price Index (CPI) stood at 129.5, indicating a 29.5 percent increase in the overall basket of goods since the 2018 base year. This also represents a 0.3 percent rise compared to the same month last year. (Figure 4)
Source: Philippine Statistics Authority, Retail Price Survey of Commodities for the Generation of Consumer Price Index
*Year-on-year changes of average CPI for March 2024 vs March 2025
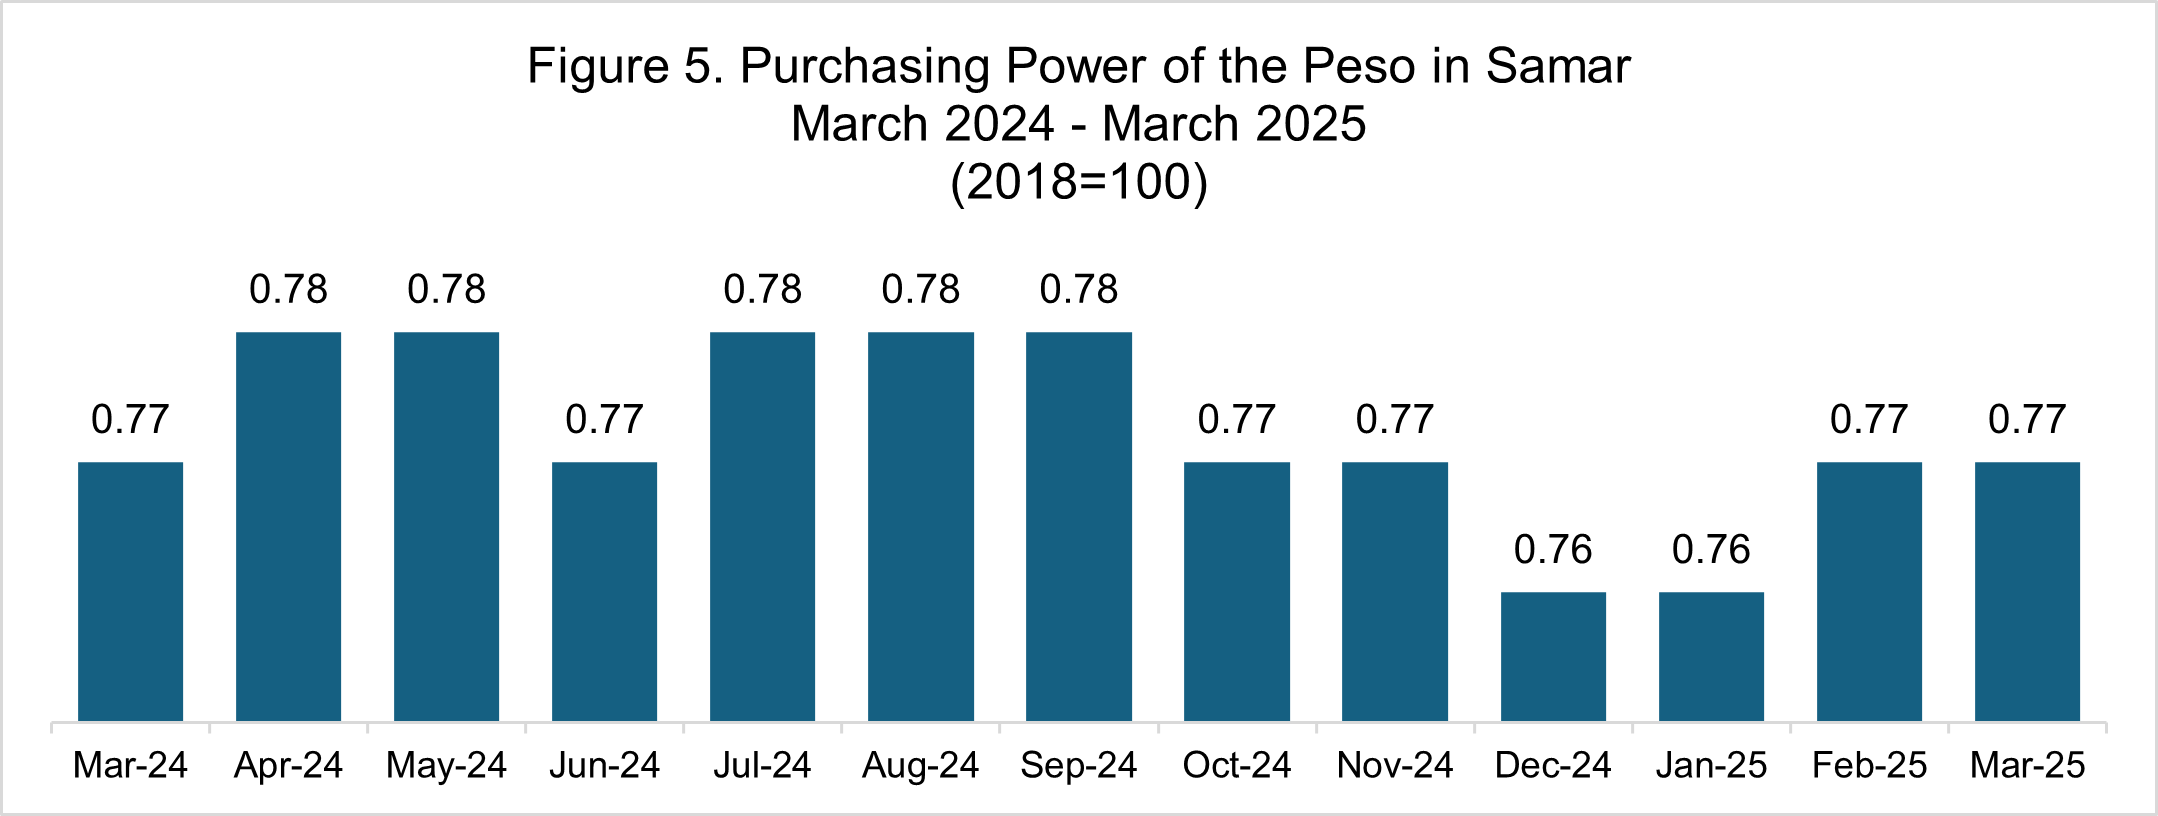
Purchasing Power of the Peso (PPP) remains at 0.77 in March 2025
The Purchasing Power of the Peso (PPP) in Samar remained at 77 centavos. This means that a peso in 2018 is equivalent to 77 centavos in March 2025. (Figure 5)
Source: Philippine Statistics Authority, Retail Price Survey of Commodities for the Generation of Consumer Price Index
*Year-on-year changes of average CPI for March 2024 vs March 2025
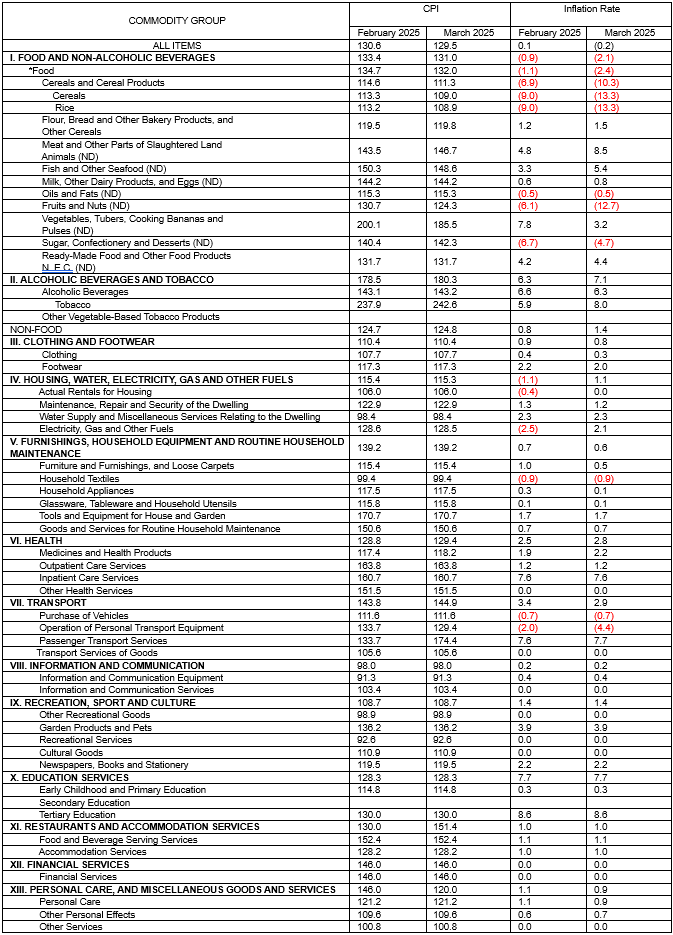
Table 1. Consumer Price Index and Inflation Rate for All Income
Households in Samar By Commodity
February 2025 – March 2025
(2018=100)
Source: Philippine Statistics Authority, Retail Price Survey of Commodities for the Generation of Consumer Price Index
*Year-on-year changes of average CPI for March 2024 vs March 2025
TECHNICAL NOTES
Base Period – it is a reference period, usually a year, at which the index number is set to 100. It is the reference point of the index number series.
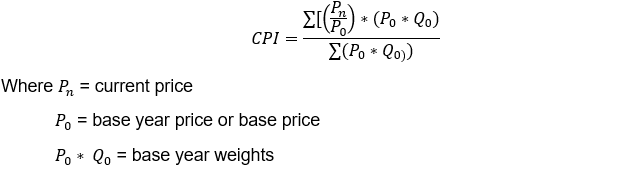
Consumer Price Index – is an indicator of the change in the average retail prices of a fixed basket of goods and services commonly purchased by an average Filipino household. It shows how much on the average, prices of goods and services have increased or decreased from a particular reference period known as a base year. The formula used in computing the CPI is the weighted arithmetic mean of price relatives, a variant of the Laspeyres formula with fixed base year period weights as shown below:
Headline Inflation – measures changes in the cost of living based on movements in the price of a specified basket of major commodities. It refers to the annual rate of change or the year-on—year changes in the CPI.
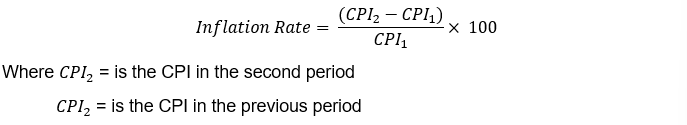
Inflation Rate – refers to the annual rate of change or the year-on-year changes of the CPI expressed in percent. Inflation is interpreted in terms of declining purchasing power of money. Inflation rate is computed as:
Market Basket – For CPI purposes, market basket is a term used to refer to a sample of goods and services that are commonly purchased and bought by an average Filipino household.
Price – The amount or value paid in exchange for the commodity or a service rendered.
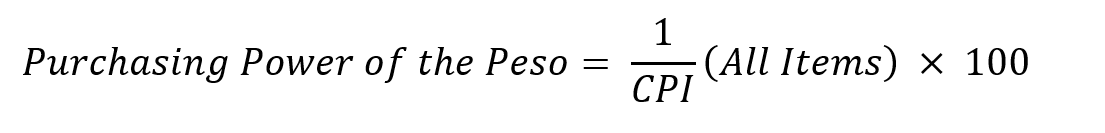
Purchasing Power of the Peso (PPP) – Shows how much the peso in the base period is worth in the current period. It is computed as the reciprocal of the CPI for the period under review multiplied by 100.
Retail/Consumer Price – Refers to the price at which a commodity is sold in small quantities for consumption.
Unit of Measure – Refers to which a commodity is customarily traded in the market. The unit of measure is used as the basis for pricing for consistency and to prevent misunderstanding between the price collector and the respondent.
Weight – A value attached to a commodity or group of commodities to indicate the relative importance of that commodity or group of commodities in the market basket
RIZA N. MORALETA
Chief Statistical Specialist
| Attachment | Size |
|---|---|
|
|
531.81 KB |