

Release Date :
Reference Number :
202408-0800-34
Eastern Visayas
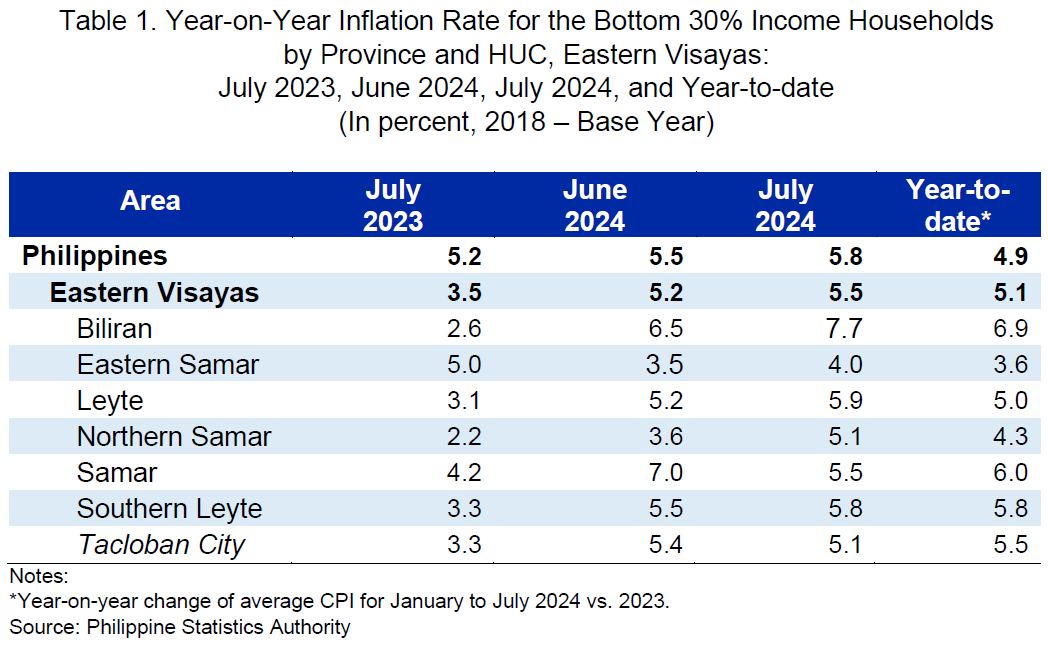
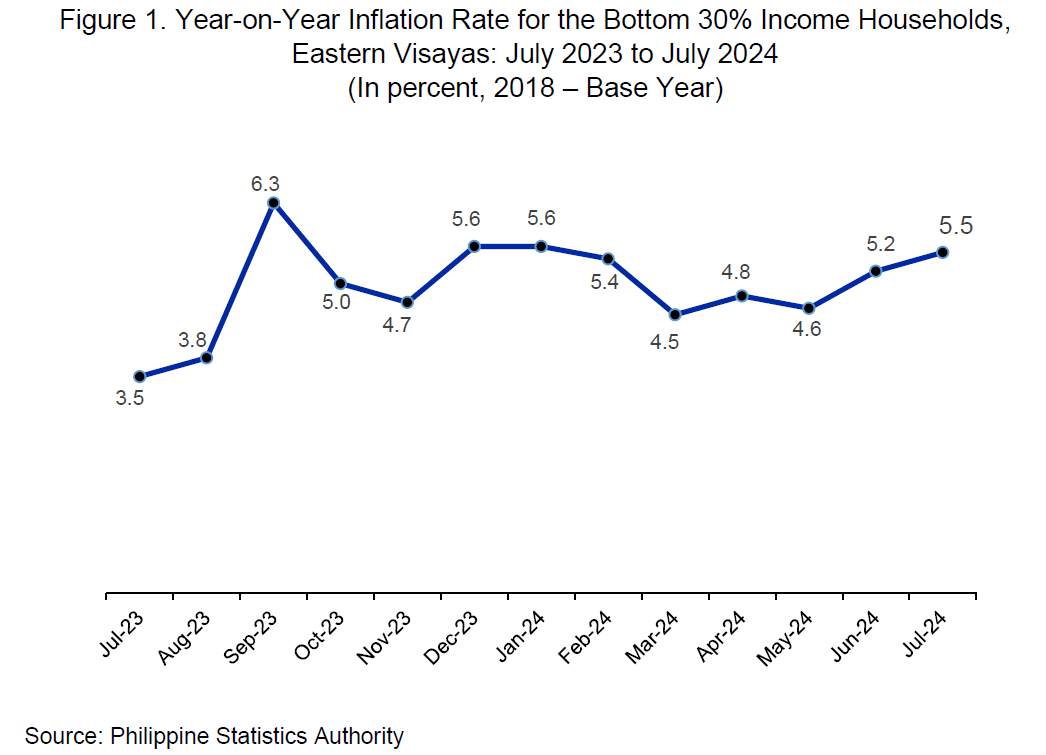
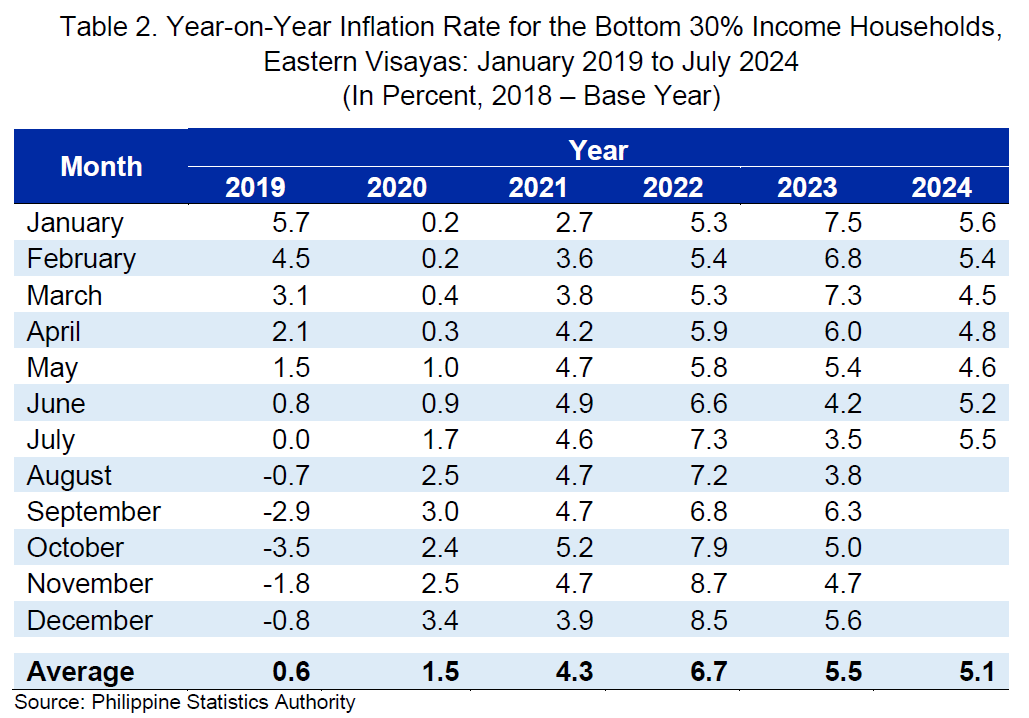
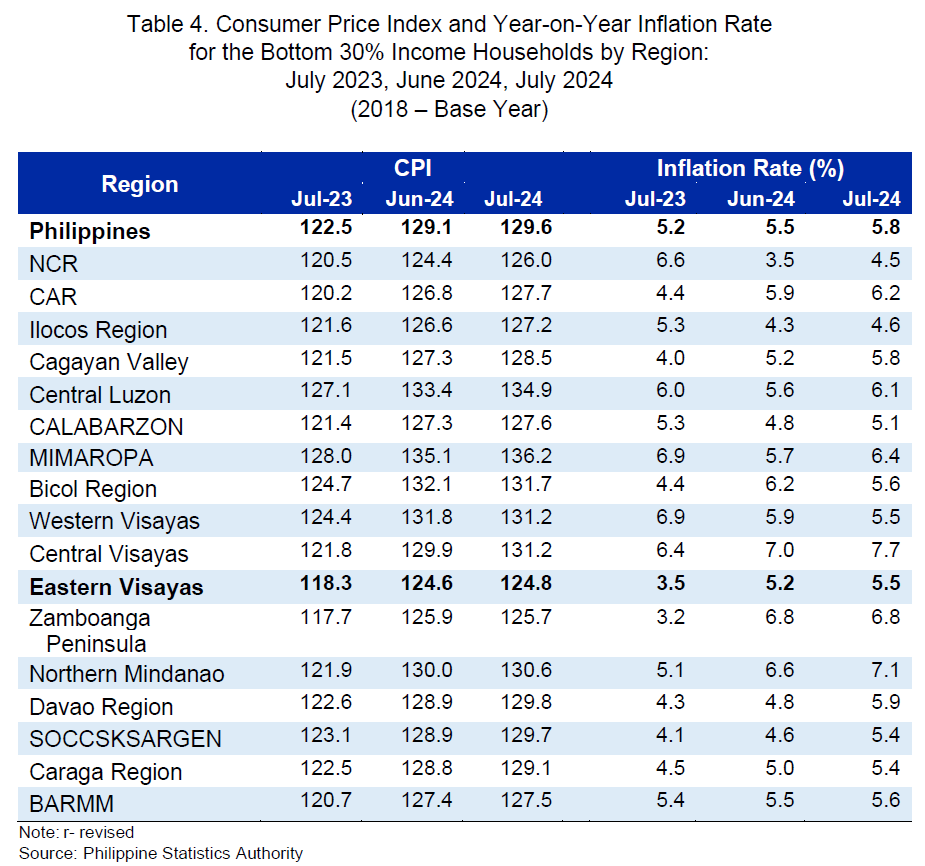
The Inflation Rate (IR) for the bottom 30 percent income households in Eastern Visayas increased to 5.5 percent in July 2024 from 5.2 percent in June 2024. This brings the average inflation rate from January to July 2024 for this income group to 5.1 percent. Moreover, the regional IR for the bottom 30 percent income household was lower than the 5.8 percent national IR for the same income group in July 2024. In July 2023, the regional IR for this income group was lower at 3.5 percent (Tables 1 and 2).
Main Drivers of the Upward Trend of the Regional Inflation
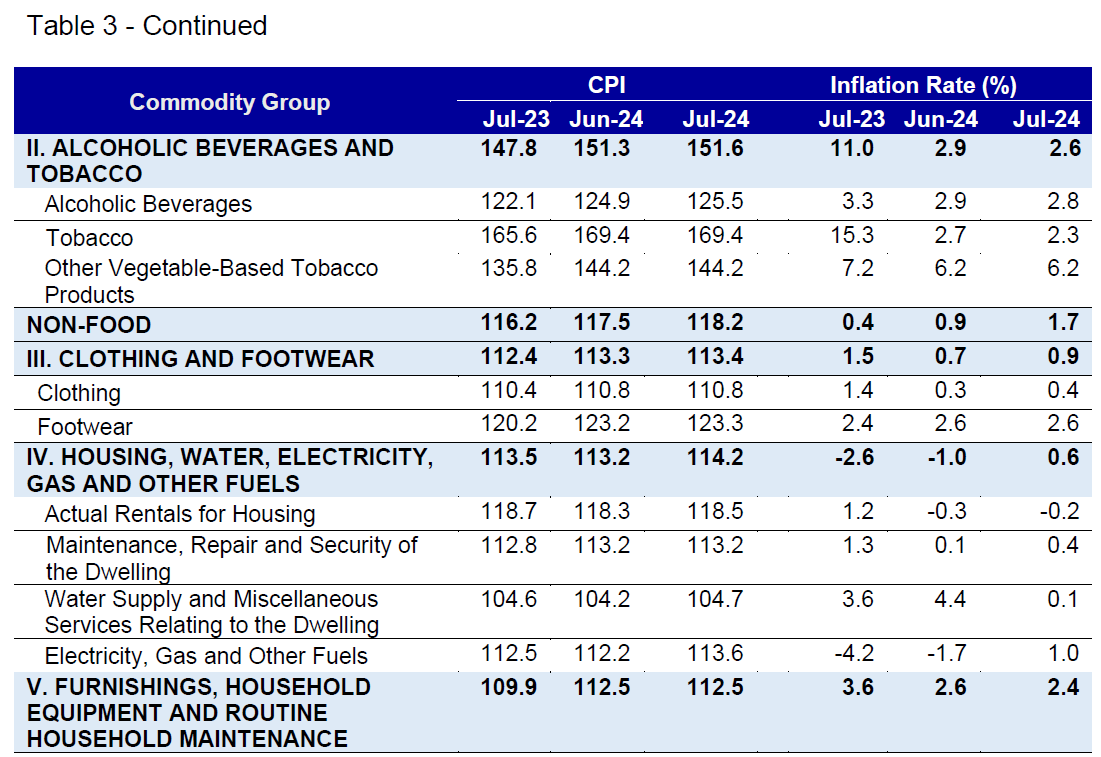
The main driver of the upward trend of the regional inflation for the bottom 30 percent income households in July 2024 was the annual price increase in housing, water, electricity, gas and other fuel at 0.6 percent from an annual price decrease of 1.0 percent in the previous month. The transport commodity group with faster IR of 2.0 percent in July 2024 from 1.3 percent in June 2024 also contributed to the uptrend.
Moreover, higher IRs were noted in the indices of the following commodity groups during the month:
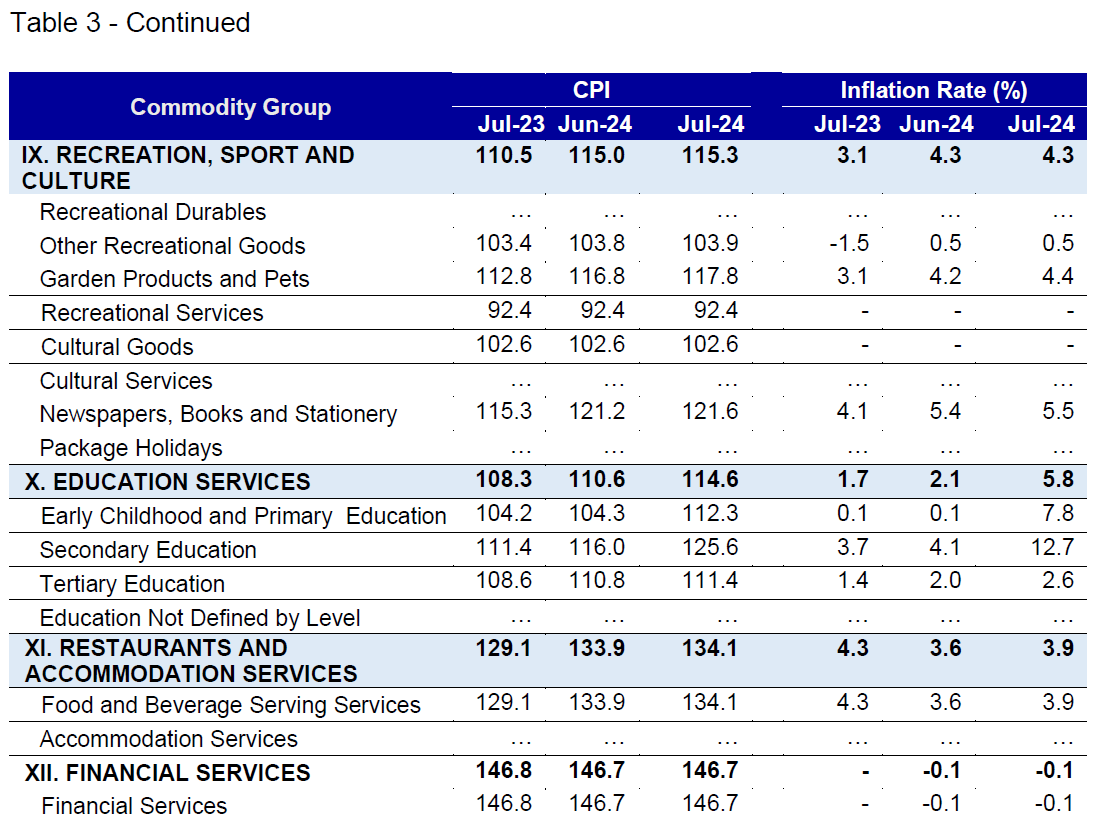
a. Restaurants and accommodation services, 3.9 percent from 3.6 percent;
b. Education services, 5.8 percent from 2.1 percent; and
c. Clothing and footwear, 0.9 percent from 0.7 percent.
On the other hand, compared with their IRs in June 2024, the following commodity groups recorded lower IRs during the month:
a. Alcoholic beverages and tobacco, 2.6 percent from 2.9 percent;
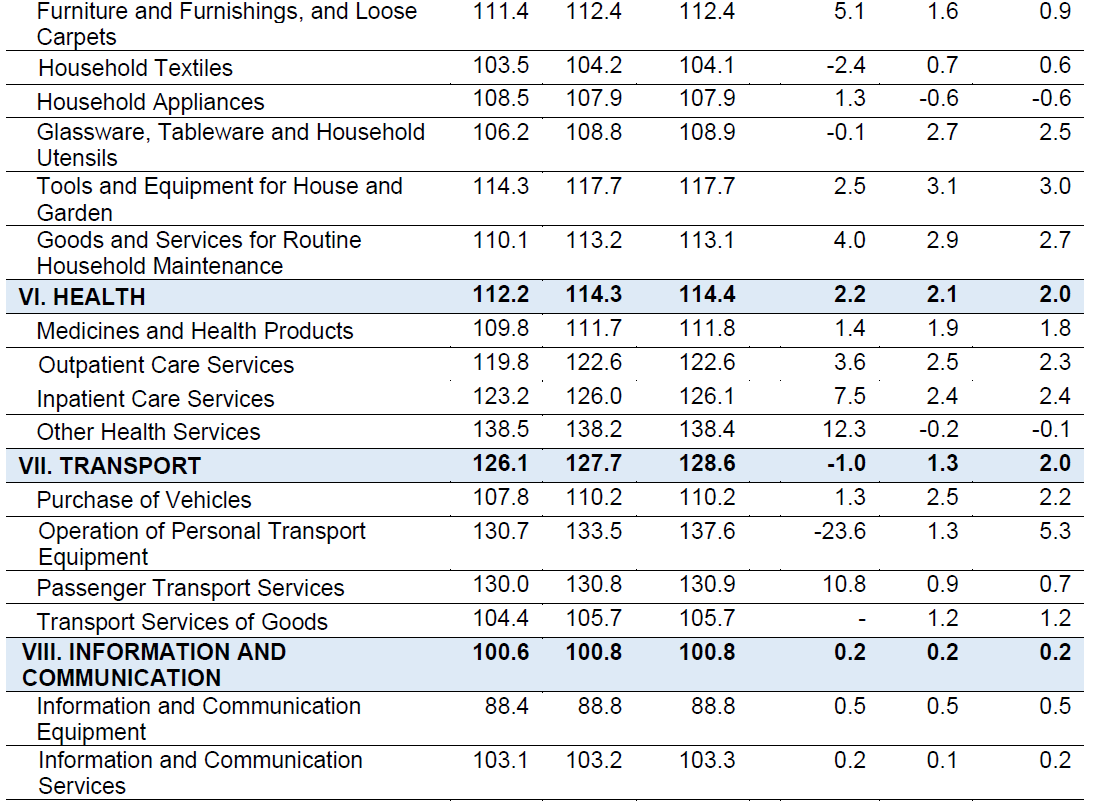
b. Furnishings, household equipment and routine household maintenance, 2.4 percent from 2.6 percent;
c. Health, 2.0 percent from 2.1 percent; and
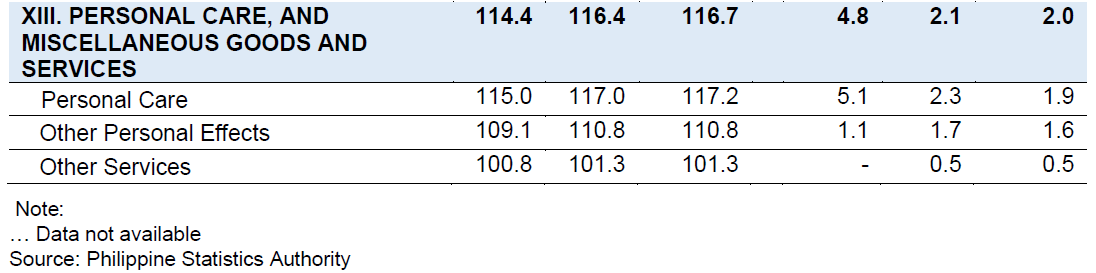
d. Personal care, and miscellaneous goods and services, 2.0 percent from 2.1 percent.
The commodity groups of food and non-alcoholic beverages, information and communication, and recreation, sport and culture, retained their previous month’s IRs at 8.2 percent, 0.2 percent, and 4.3 percent, respectively. Meanwhile, financial services maintained its 0.1 percent annual price decrease in June 2024.
Main Contributors to the Regional Inflation
The top three commodity groups that contributed to the July 2024 regional IR for the bottom 30 percent income households were the following:
a. Food and non – alcoholic beverages with 87.1 percent share or 4.8 percentage points;
b. Restaurants and accommodation services, with 2.8 percent share or 0.2 percentage point; and
c. Transport, with 2.1 percent share or 0.1 percentage point.
Food Inflation
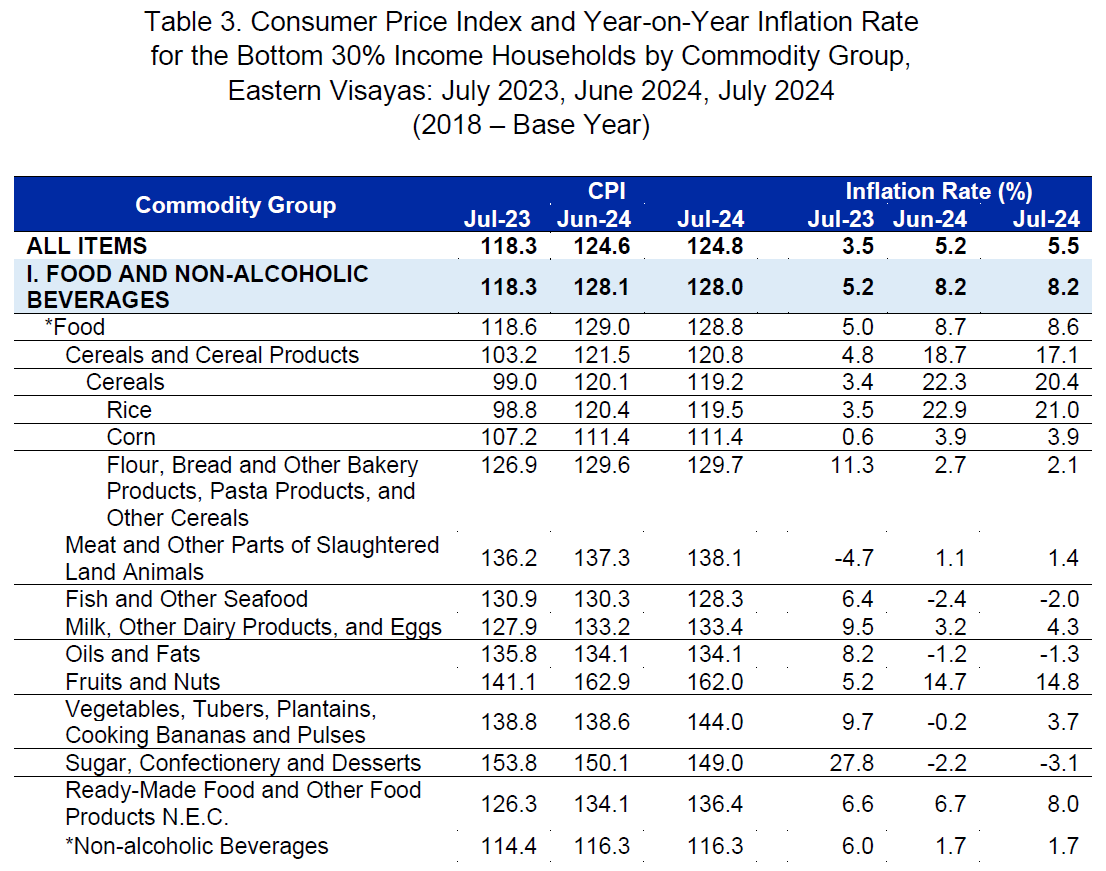
Food inflation for the bottom 30 percent income households in Eastern Visayas decreased to 8.6 percent in July 2024 from 8.7 percent in the previous month. In
July 2023, food inflation was posted at 5.0 percent (Table 3).
The decline of food inflation was primarily due to the slower IR observed in rice at 21.0 percent in July 2024 from 22.9 percent in the previous month. Flour, bread, and other bakery products, pasta products, and other cereals also recorded slower IR at 2.1 percent in July 2024 from 2.7 percent in June 2023. In addition, faster annual price decreases were registered in sugar, confectionary and desserts; and oils and fats at 3.1 percent and 1.3 percent in July 2024, from 2.2 percent and 1.2 percent annual decline in June 2024, respectively.
In contrast, compared with their previous month’s IRs, faster IRs were observed in the following food groups:
a. Meat and other parts of slaughtered land animals, 1.4 percent from 1.1 percent;
b. Milk, other dairy products and eggs, 4.3 percent from 3.2 percent;
c. Fruits and nuts, 14.8 percent from 14.7 percent; and
d. Ready-made food and other food products not elsewhere classified, 8.0 percent from 6.7 percent.
In addition, fish and other seafood registered slower annual price decrease at 2.0 percent in July 2024 from 2.4 percent annual decrease in June 2024. Vegetables, tubers, plantains, cooking bananas and pulses posted an IR of 3.7 percent during the month from an annual price decrease of 0.2 percent in June 2024.
Meanwhile, corn retained its previous month’s IR at 3.9 percent.
Main Contributors to the Food Inflation
Food inflation shared 85.9 percent or 4.7 percentage points to the regional inflation for the bottom 30 percent income household in July 2024. The food groups with the highest contribution to the food inflation during the month were the following:
a. Cereals and cereal products, which include rice, corn, flour, bread and other bakery products, pasta products, and other cereals, with 89.8 percent share or 7.7 percentage points;
b. Fruits and nuts, with 4.8 percent share or 0.4 percentage point; and
c. Ready-made food and other food products not elsewhere classified, with 2.7 percent share or 0.2 percentage point.
Inflation Rate by Region
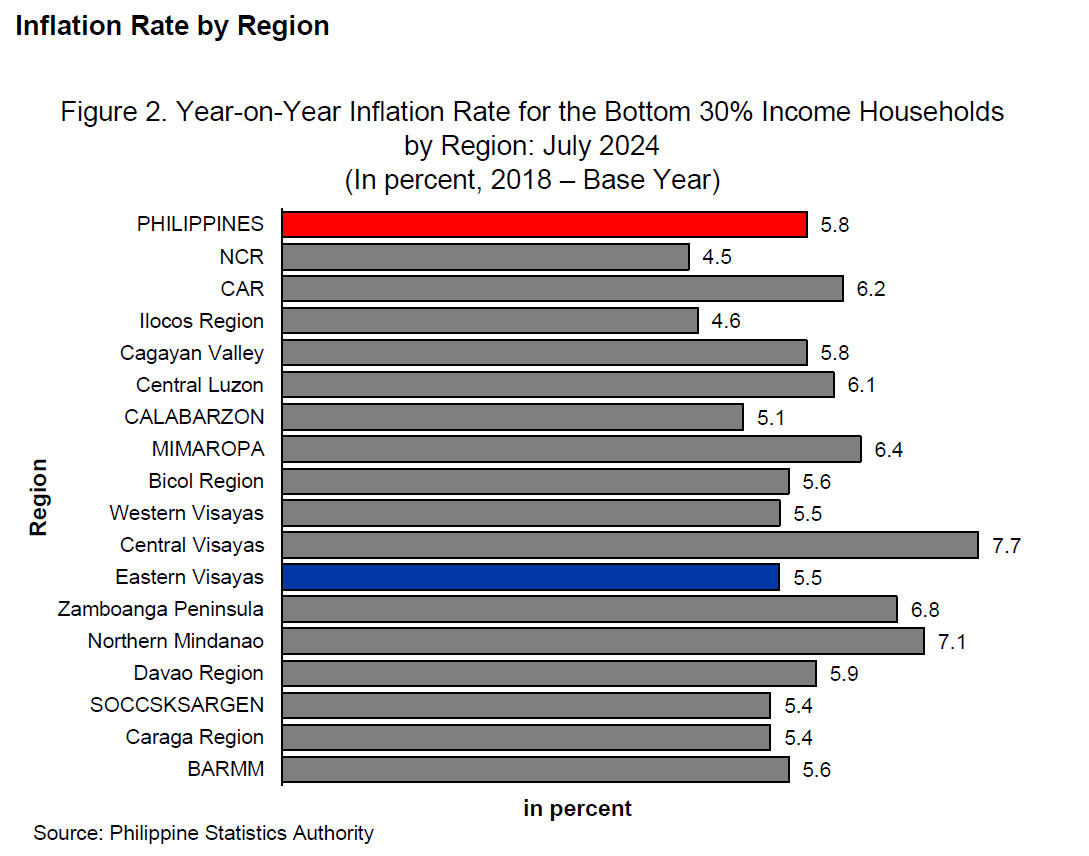
In comparison to their IRs in June 2024, 14 regions registered higher IRs for the bottom 30 percent income households in July 2024, two (2) regions registered lower IRs, while the remaining one (1) retained its previous month’s IR. Eastern Visayas’ IR for the bottom 30 percent income households at 5.5 percent ranked fifth among the regions with low IR during the month in review and was at par with Western Visayas. In July 2024, the highest IR for this income group was recorded in Central Visayas at 7.7 percent, while the lowest IR was observed in NCR at 4.5 percent (Figure 2 and Table 4).
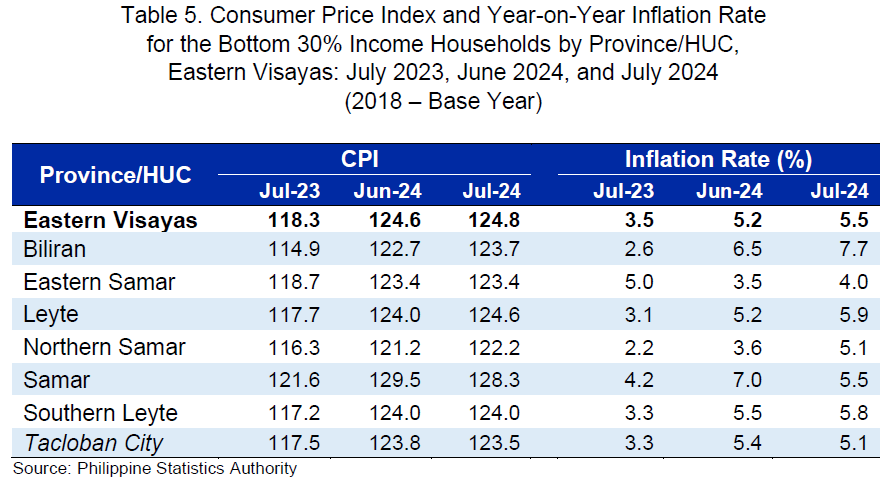
Inflation Rate by Province
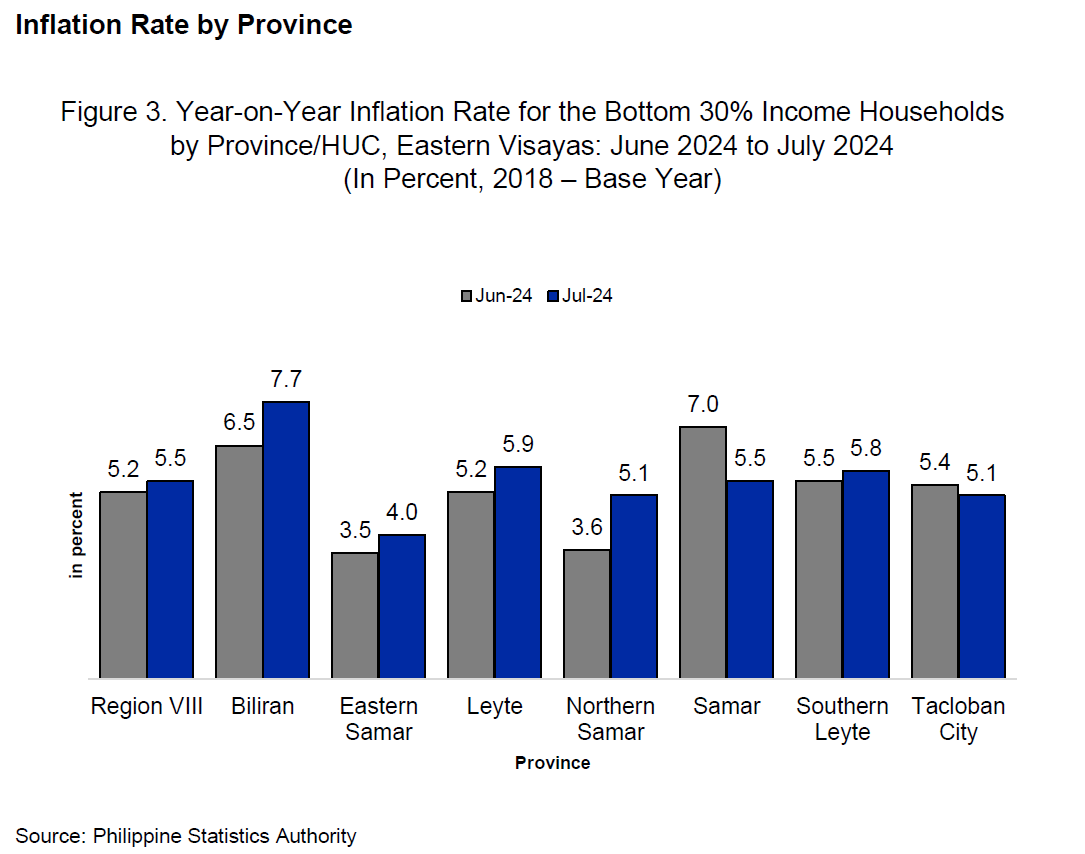
Relative to their IRs for the bottom 30 percent income households in June 2024, Biliran, Eastern Samar, Leyte, Northern Samar, and Southern Leyte recorded higher IRs in July 2024. On the other hand, Samar, and the Highly Urbanized City (HUC) of Tacloban registered lower IRs during the month. For this income group, Biliran registered the highest IR among the provinces at 7.7 percent. This was followed by Leyte at 5.9 percent, Southern Leyte at 5.8 percent, Samar at 5.5 percent, and Northern Samar at 5.1 percent. The lowest IR for this income group was noted in Eastern Samar at 4.0 percent. Meanwhile, IR for the bottom 30 percent income households in Tacloban City was recorded at 5.1 percent in July 2024 (Figure 3 and Table 5).
TECHNICAL NOTES
The CPI for the bottom 30% income households is compiled by the PSA to measure the changes of prices of commodities commonly purchased by the families that belong to the bottom 30% income decile. The process of price collection and CPI computation is the same as that of the CPI for all income households. However, there is a separate market basket and weights for the CPI for the bottom 30% income households.
BASE YEAR - is a period at which the index number is set to 100. It is the reference point of the index number series. The CPI is rebased from 2012 to 2018.
CONSUMER PRICE INDEX (CPI) - is an indicator of the change in the average prices of a fixed basket of goods and services commonly purchased by households relative to a base year.
DEFLATION - is the decline in prices for goods and services that happens when the inflation rate dips below zero percent.
INFLATION RATE (IR) - is the annual rate of change or the year-on-year changes in CPI. It indicates how fast or how slow price changes over two time periods (year-on-year). Contrary to common knowledge, low inflation does not necessarily connote that prices of commodities are falling. It means that prices continue to increase but at a slower rate.
MARKET BASKET - refers to a sample of goods and services commonly purchased by the households. The market basket for CPI was updated using the results of the 2021 Survey of Key Informants (SKI). The commodities included in the 2018-based CPI market basket were the modal commodities which were considered as the most commonly purchased/availed commodities by the households. The commodities in the 2018-based CPI market basket were grouped/classified according to the 2020 Philippine Classification of Individual Consumption According to Purpose (PCOICOP).
MONITORING OF PRICES - involves establishing baseline information for the prices of the items in the base year and monitoring the prices of the items on a regular basis. Data collection for the CPI is done by the provincial office twice a month, except for petroleum products which are monitored on a weekly basis, every Friday. First collection phase is done during the first five days of the month while the second phase is on the 15th to 17th day of the month.
PURCHASING POWER OF PESO (PPP) - gives an indication of the real value of peso (how much it is worth) in a given period relative to its value in the base period. It is computed as the reciprocal of CPI multiplied by 100.
RETAIL PRICE - refers to the actual price at which retailers sell a commodity on spot or earliest delivery, usually in small quantities for consumption and not for resale. It is confined to transactions on cash basis in the free market and excludes underground prices and prices of commodities that are on sale as in summer sales, anniversary sales, Christmas sales, etc.
WEIGHTS - is a value attached to a commodity or group of commodities to indicate the relative importance of that commodity or group of commodities in the market basket. The weights for the 2018-based CPI were derived from the expenditure data of the 2018 Family Income and Expenditure Survey (FIES). The weight for each commodity/group of commodities is the proportion of the expenditure commodity/group of commodities to the total national expenditure. The sum of the weights of the commodity groups at the national level is equal to 100.
Sgd.WILMA A. PERANTE
Regional Director
| Attachment | Size |
|---|---|
|
|
450.69 KB |