

Release Date :
Reference Number :
SR-2025-0826-06
EASTERN SAMAR
1. Headline Inflation
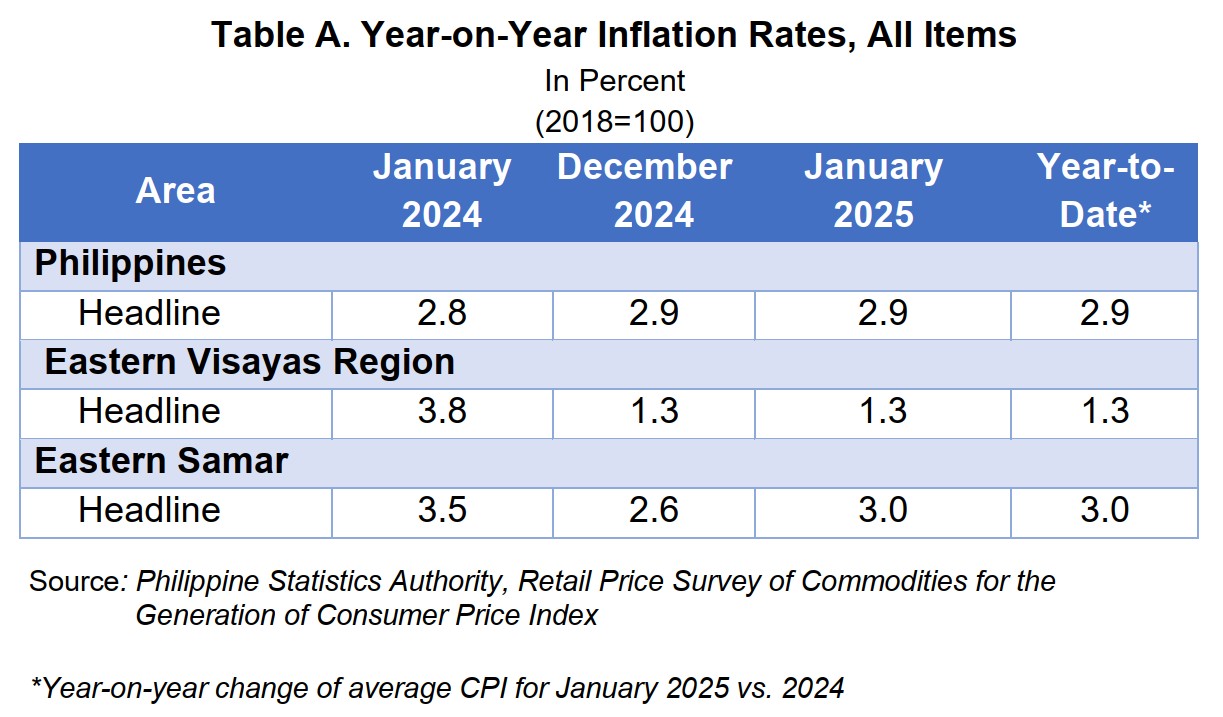
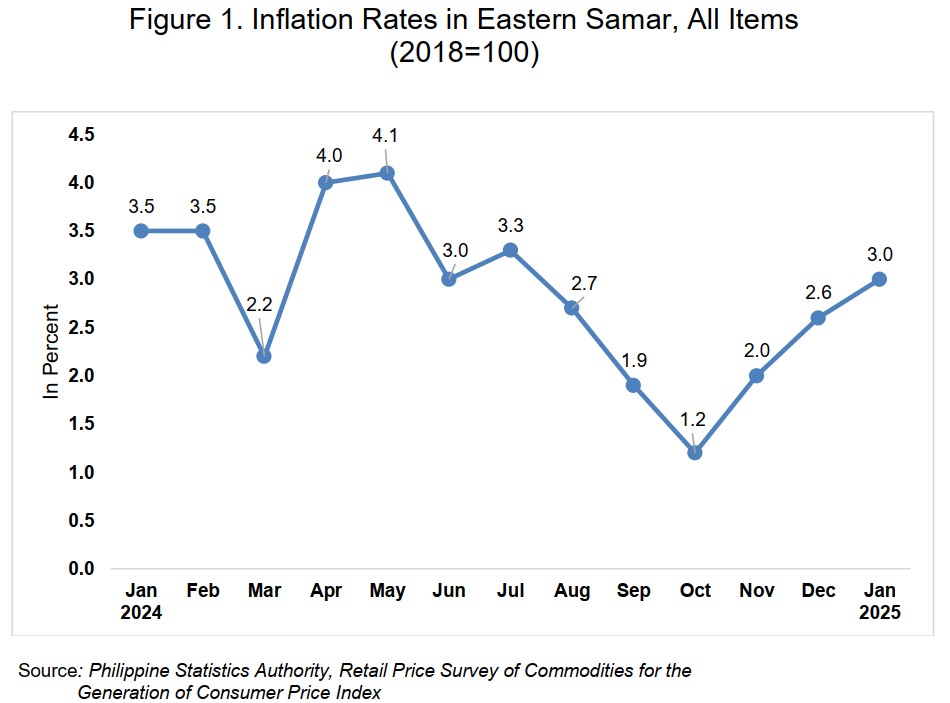
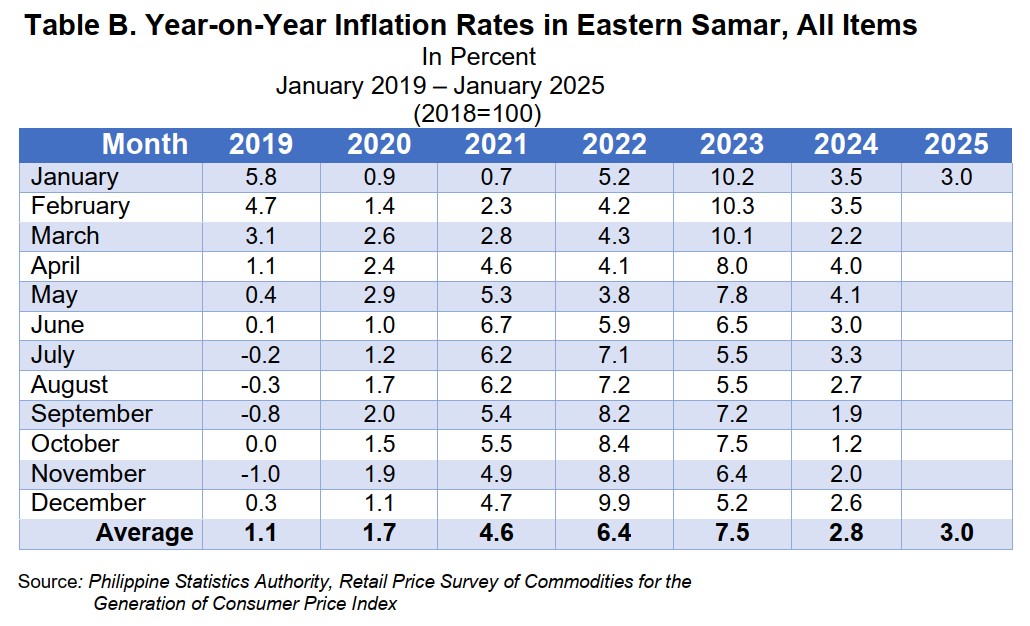
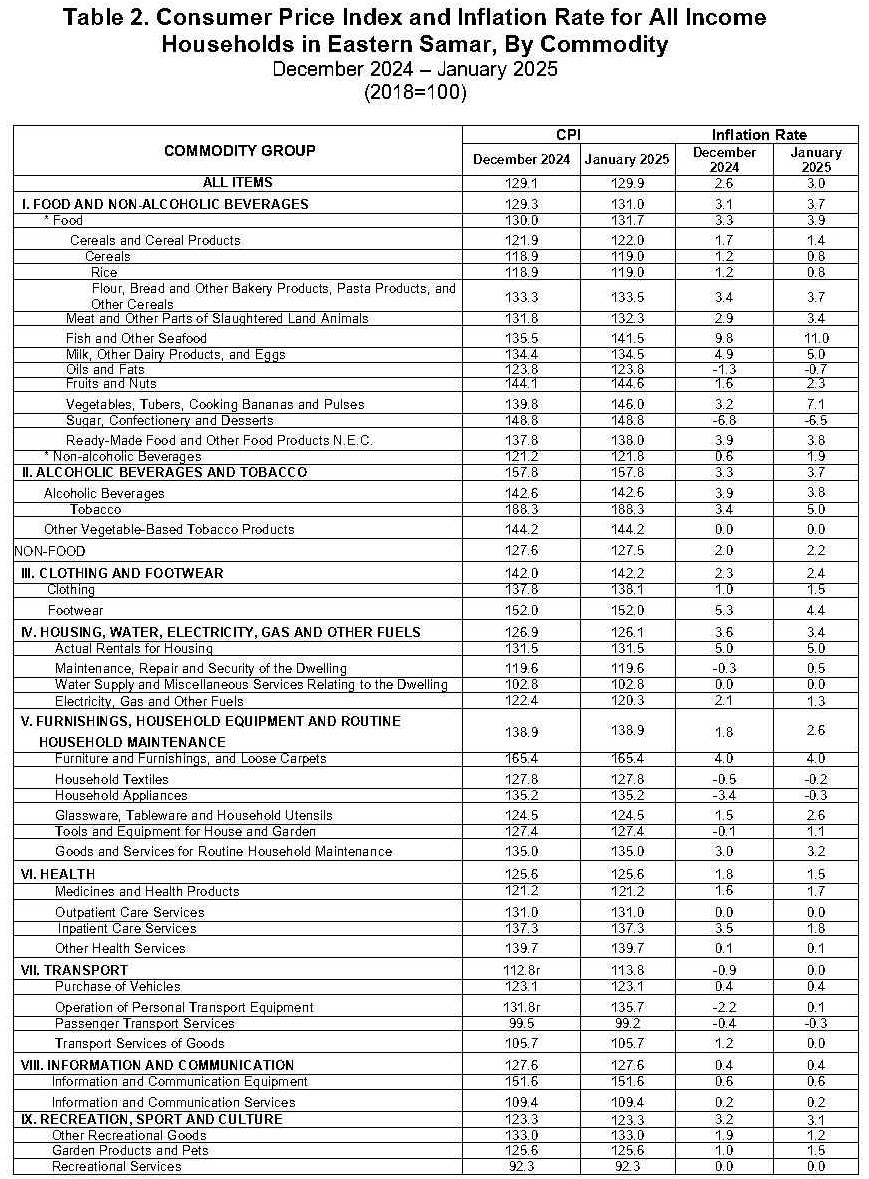
Inflation Rate (IR) in Eastern Samar accelerates to 3.0 percent in January 2025 from 2.6 percent in December 2024. The Province’s inflation rate is higher than the 1.3 percent IR in Region VIII and the 2.9 percent IR of the Philippines. In January 2024, inflation rate was higher at 3.5 percent. (Figure 1, and Tables A and B)
Main Drivers of the Upward Trend of Eastern Samar’s Inflation
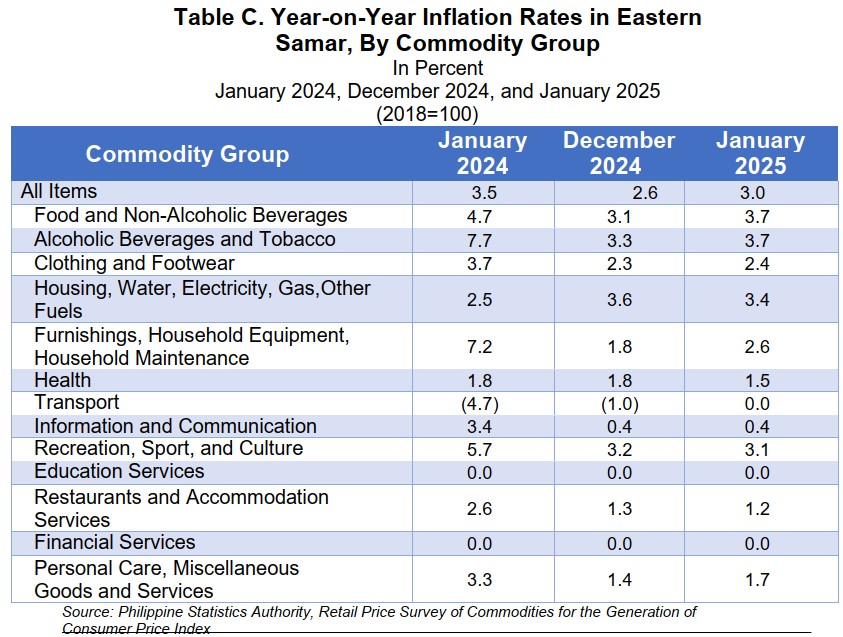
The upward trend in the province’s inflation rate in January 2025 was mainly driven by a faster annual increase of the heavily-weighted food and non-alcoholic beverages at 3.7 percent from a 3.1 percent annual increase in December 2024. Also, transport, which recorded a zero percent inflation rate from an annual decrease of 1.0 percent, and the higher inflation rate of furnishings, household equipment and routine household maintenance at 2.6 percent from a 1.8 percent annual increase in the previous month, contributed to the upward trend of the province’s inflation. (Table C)
In addition, the following commodities registered faster inflation rates in January 2025:
(a) Personal care, and miscellaneous goods and services,1.7 percent from 1.4 percent;
(b) Alcoholic beverages and tobacco, 3.7 percent from 3.3 percent; and
(c) Clothing and footwear, 2.4 percent from 2.3 percent.
On the other hand, lower inflation rates were recorded in the following commodity groups in January 2025:
(a) Housing, water, electricity, gas and other fuels, 3.4 percent from
3.6 percent;
(b) Health, 1.5 percent from 1.8 percent;
(c) Recreation, sport and culture, 3.1 percent from 3.2 percent; and
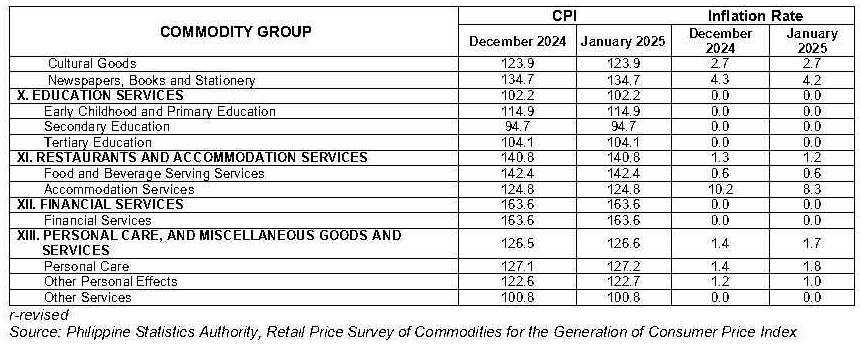
(d) Restaurants and accommodation services, 1.2 percent from 1.3 percent.
Meanwhile, information and communication, education services, and financial services maintained their respective previous month’s inflation rates at 0.4 percent, 0.0 percent and 0.0 percent, respectively.
Top Three Main Contributors to Eastern Samar Inflation
The following commodity groups were the top three (3) contributors to the January 2025 inflation of the province of Eastern Samar:
a. Food and non-alcoholic beverages with 63.0 percent share or 1.89 percentage points;
b. Housing, water, electricity, gas and other fuels with 20.8 percent share or 0.62 percentage point; and
c. Furnishings, Household Equipment and Routine Household Maintenance with 3.2 percent share or 0.10 percentage point.
2. Food Inflation
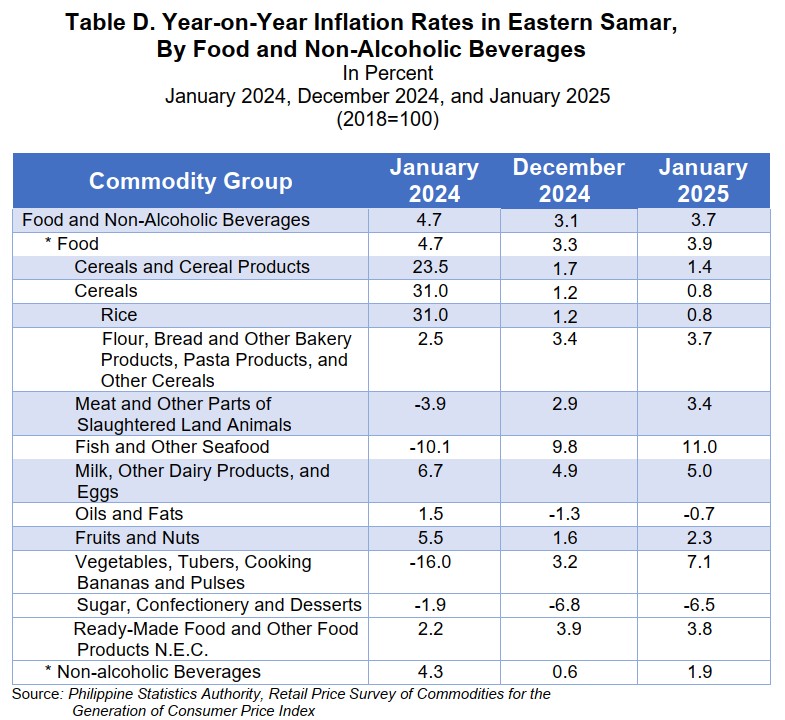
Inflation rate of Food in the Province in January 2025 accelerated to 3.9 percent from 3.3 percent in the previous month. In January 2024, food inflation was higher at 4.7 percent. (Table D)
Main Drivers of the Upward Trend of Food Inflation
The upward trend of food inflation in January 2025 was primarily due to the faster inflation rate of vegetables, tubers, plantains, cooking bananas and pulses at 7.1 percent from an annual inflation rate of 3.2 percent in December 2024. Also, the annual increase in fish and other seafood and meat and other parts of slaughtered land animals at 11.0 percent and 3.4 percent, respectively from an annual increase of 9.8 percent and 2.9 percent, respectively in the previous month contributed to the upward trend of the province’s food inflation.
Also, the following food groups registered faster annual increase in their inflation rates in January 2025 compared to that in the previous month:
(a) Fruits and nuts, 2.3 percent from 1.6 percent;
(b) Milk, other dairy products and eggs, 5.0 percent from 4.9 percent; and
(c) Flour, bread, and other bakery products, pasta products and other cereals, 3.7 percent from 3.4 percent.
Meanwhile, sugar, confectionery and desserts, and oils and fats recorded slower annual decrease in inflation rates at 6.5 percent and 0.7 percent, respectively from an annual decline of 6.8 percent and 1.3 percent, respectively in December 2024.
On the other hand, rice and ready-made food and other food products not elsewhere classified, posted slower inflation rates at 0.8 percent and 3.8 percent, respectively from 1.2 percent and 3.9 percent, respectively in the previous month.
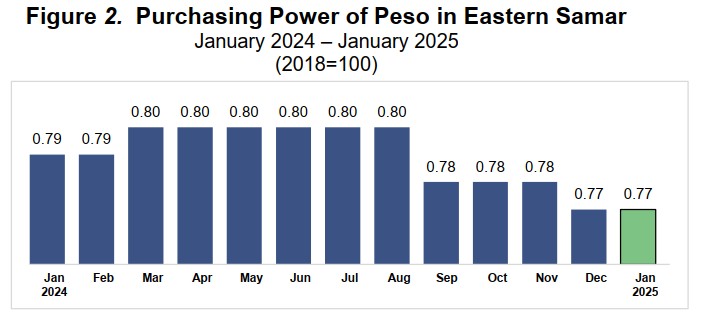
For this month, the Purchasing Power of Peso (PPP) in Eastern Samar remained at 77 centavos. This indicates that a peso in 2018 has a value of 77 centavos in January 2025. (Figure 2)
TECHNICAL NOTES
Consumer Price Index (CPI) - is an indicator of the change in the average retail prices of a fixed basket of goods and services commonly purchased by households relative to a base year. It shows how much on the average, prices of goods and services have increased or decreased from a reference period known as the base year. The current CPI series is 2018-based.
The 2018 FIES expenditure data were used to directly estimate the 2018 CPI weights at the national and regional levels. However, the 2018 FIES estimates for the expenditure data at the provincial level were not directly utilized in estimating the CPI expenditure weights as the data at the provincial/city level may not be reliable with the use of the households' master sample (MS) that was utilized in selecting the 2018 FIES sample households. The MS was drawn using regions as domains in generating estimates in all the household surveys of the PSA starting July 2013. The provincial/city expenditure data were derived using the model-based method in small area estimation procedures using the regional expenditure data as the control total for all the expenditure data within the specific region. Using these estimates, the weight for each item of expenditure is computed as a proportion of that item of expenditure to the total national expenditure. A raking procedure was done to adjust the weights of the provinces so that the provincial weights when added up will equal to the regional weights.
The formula used in computing the CPI is the weighted arithmetic mean of price relatives, a variant of the Laspeyres formula with fixed base year period weights as shown below:
∑ [(Pn / P0) * (P0*Q0)]
CPI = X 100
∑(P0*Q0)
where Pn = current price P0 = base year price or base price P0 * Q0 = base year weights
Base Period or Base Year - is the period, usually a year, at which the index number is set to 100. It is the reference point of the index number series.
Market Basket - is a term used to refer to a sample of goods and services that are commonly purchased and bought by an average Filipino household.
Inflation Rate (IR) - is defined as the annual rate of change or the year-to-year change in the CPI and is computed as:
(CPI2 – CPI1)
Inflation Rate = X 100
CPI1
where CPI2 = is the CPI in the second period CPI1 = is the CPI in the previous period
Purchasing Power of the Peso (PPP) - is a measure of the real value the peso in a given period relative to a chosen reference period. It is computed by getting the reciprocal of the CPI and multiplying the result by 100.
PPP = (1/CPI (All Items) *100
RONNIE A. BAJADO
Chief Statistical Specialist
| Attachment | Size |
|---|---|
|
|
603.69 KB |