

Release Date :
Reference Number :
25SR0837-058
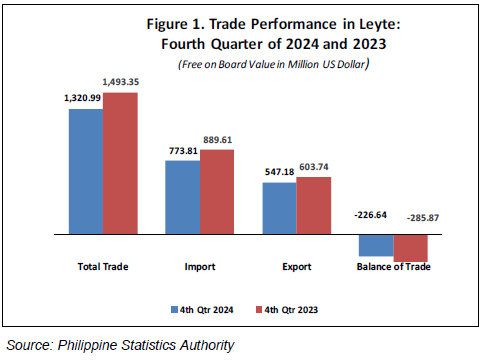
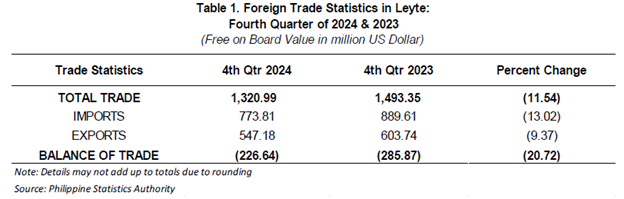
Leyte’s Trade of Goods accelerates to $1.3 billion for the Fourth Quarter of 2024
The total trade in Leyte (including Tacloban City) for the fourth quarter of 2024 amounted to $1.3 billion lower by 11.54 percent compared to $1.5 billion total trade in the same period of 2023. Total value of imports in the province posted at $773.81 million while total exports amounted to $547.18 million for the fourth quarter of 2024. This translates to a Balance of Trade (BoT) of -$226.64 million.
Leyte’s Value of Imports decreases by 13.02 percent for the Fourth Quarter of 2024
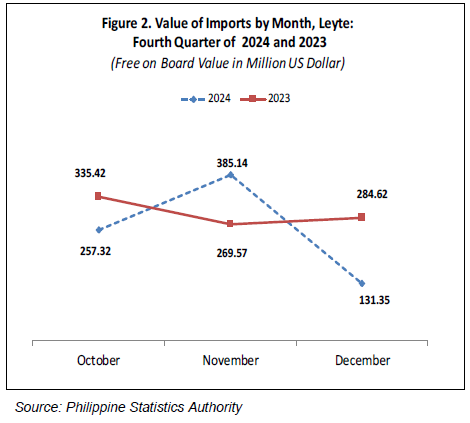
Total value of imports in Leyte decelerates from $889.61 million in the fourth quarter of 2023 to $773.81 million in the fourth quarter of 2024.
As shown in Figure 2, the value of imports in October and December of 2024 were lower compared with the same period of 2023. Value of imports was lower by 23.28 percent from $335.42 million of October 2023 to $257.32 million of October 2024. Similarly, the value of imports for December 2024 posted at $131.35 million, lower by 53.86 percent from $284.62 million of December 2023.
Meanwhile, the value of imports for November 2024 which posted at $385.14 million was higher by 42.87 percent from $269.57 million of the same period in 2023.
Total Exports in Leyte posted at $547.18 million in the Fourth Quarter of 2024
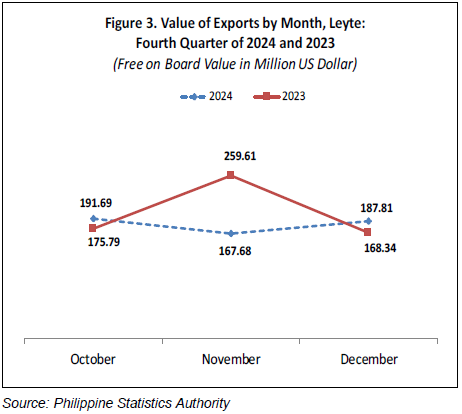
Leyte’s exports decelerated to $547.18 million in the fourth quarter of 2024, lower by 9.37 percent from $603.74 million in the fourth quarter of 2023.
A different scenario was observed in the exports monthly performance of the province. Monthly exports for October and December 2024 were higher compared in 2023. The value of exports in October 2023 ($175.79 million) and December 2023 ($168.34 million) increases to $191.69 million and $187.81 million, respectively in the same period of 2024.
However, the value of exports for November of 2023 posted a significant decrease of 35.41 percent from $259.61 million to $167.68 million in November 2024.
About 88 percent of Leyte’s Total Imports passes through LIDE Port
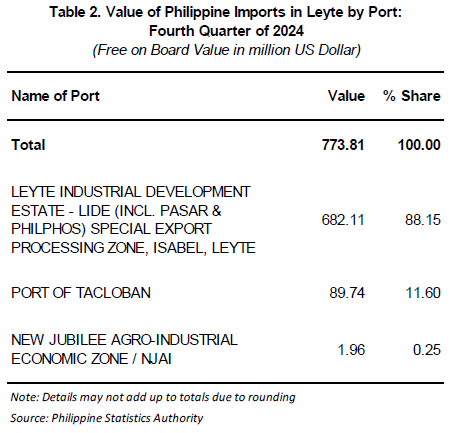
Eighty eight percent of imports in Leyte came from the port of Leyte Industrial Development Estate (LIDE). This is a Special Export Processing Zone in Isabel, Leyte which include PASAR and PHILPHOS. This port posted an aggregate receipts of $682.11 million for the fourth quarter of 2024.
The Port of Tacloban came next comprising 11.60 percent amounting to $89.74 million.
Meanwhile, New Jubilee Agroindusrial Economic Zone/NJAI comprised 0.25 percent of Leyte’s total imports valued at $1.96 million.
LIDE Exports at $547.18 million in the Fourth Quarter of 2024
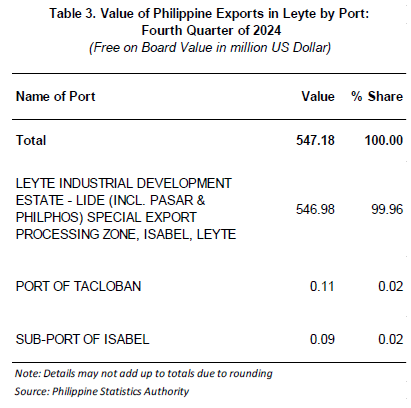
The ports in Leyte that reported to have export transactions in the fourth quarter of 2024 were Leyte Industrial Development Estate– LIDE, Port of Tacloban and Sub-Port of Isabel.
The port of LIDE posted an aggregate receipts from merchandise exports of $546.98 million which is 99.96 percent of the total export of Leyte for the quarter in review.
The port of Tacloban and Sub-Port of Isabel both comprised of 0.02 percent share with an aggregate receipts of $0.11 million and $0.09 million, respectively.
Copper ores and concentrates posted as Top Major Import in the Fourth Quarter of 2024
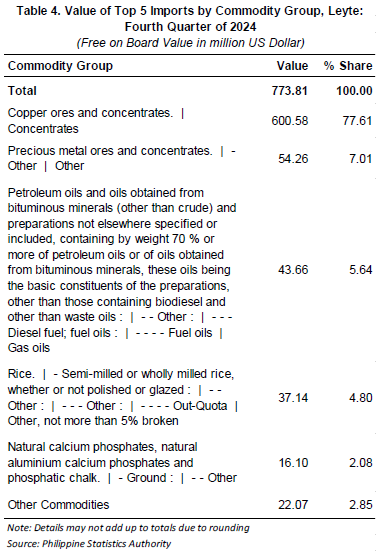
The commodity group of Copper ores and concentrates: concentrates was the major import in Leyte (including Tacloban City) during the reference quarter comprising 77.61 percent with a total value of $600.58 million. The second major import was the commodity group of Precious metal ores and concentrates. | - Other | Other amounted to $54.26 million which shared 7.01 percent of the total imports of the province.
The remaining top five commodity groups, as seen in Table 4, accounted 12.52 percent of the total imports of the province. Other remaining commodities comprised 2.85 percent with a total value of $22.07 million.
Refined copper is the Top Export commodity at $422.94 million
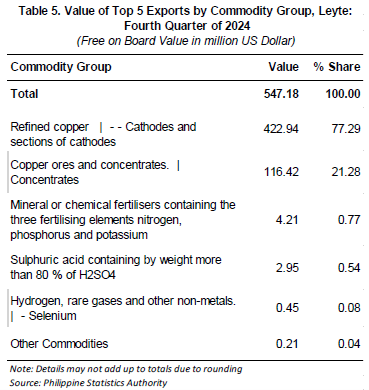
Refined copper | - - Cathodes and sections of cathodes was the major export during the reference quarter valuing at $422.94 million. This accounted for 77.29 percent of the province’s total export revenue in the fourth quarter of 2024.
The remaining top five exports include Copper ores and concentrates. | Concentrates ($116.42 million); Mineral or chemical fertilisers containing the three fertilising elements nitrogen, phosphorus and potassium ($4.21 million); Sulphuric acid containing by weight more than 80 % of H2SO4 ($2.95 million) and Hydrogen, rare gases and other non-metals. | - Selenium ($0.45 million).
These four (4) commodity groups accounted 22.67 percent of the total exports of Leyte.
Australia is Leyte’s Top Import Trading Partner in the Fourth Quarter of 2024
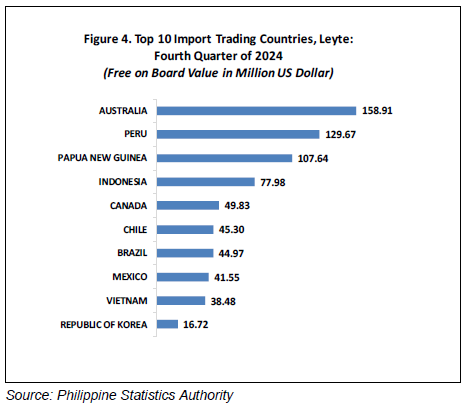
About 20.54 percent of the imported goods of Leyte in the fourth quarter of 2024 came from Australia with total value of $158.91 million. Peru ranked second posting a value of $159.67 million, followed by Papua New Guinea with a total value of $107.64 million.
The other countries which completed the top 10 import trading partners of Leyte include Indonesia ($77.98 million), Canada ($49.83 million), Chile ($45.30 million), Brazil ($44.97 million), Mexico ($41.55 million), Vietnam ($38.48 million) and Republic of Korea ($16.72 million).
Exports Receipts to People’s Republic of China valued at $244.70 million
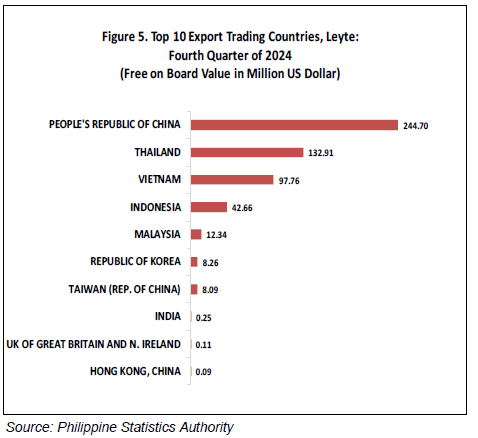
People’s Republic of China was the top export market destination of Leyte in the fourth quarter of 2024 with an aggregate receipts of $244.70 million or 44.72 percent of the total exports of Leyte.
Thailand was the second export trading parner of the province with total receipts of $132.91 million.
Vietnam ranked third valuing at $97.76 million, followed by Indonesia at $42.66 million. Malaysia ranked fifth with $12.34 million.
The rest of the countries namely Republic of Korea, Taiwan (Rep. of China), India, UK of Great Britan and N. Ireland, and Hongkong, China recorded less than $10 million exports transactions.
EXPLANATORY NOTES
Foreign trade relates to the commerce between the Philippines and other countries by sea or air, whether for private or government use or for commercial purposes, as gifts, or samples. Foreign trade statistics are used for economic planning and for formulation of trade policies and measures. These statistics are also useful for computation of balance of payments, national accounts, and net terms of trade; trade promotions; monitoring of importation of taxable and duty-exempt items including imports under the Import Liberalization Program; and for inputs in bilateral and multilateral trade negotiations.
Foreign trade statistics are compiled by the Philippine Statistics Authority (PSA) from copies of legally required documents submitted by importers and exporters to the Bureau of Customs. Exports and imports cleared through Philippine Exports Zone Authority (PEZA) forms are also included in the compiled data. PSA collects copies of the following accomplished forms:
Export Declaration (ED—DTI form)
Import Entry and Internal Revenue Declaration (BOC IEIRD Form 236)
Informal Import Declaration and Entry (BOC Form 177)
Single Administrative Documents (SAD)
The Philippines adopts the “general” trade system of recording foreign trade statistics and the customs frontier (not the national boundary) is used as the statistical frontier. Under this system, all goods entering any seaport or airport of the Philippines that are properly cleared by Customs or remaining under customs control are considered imports. These goods are imports regardless if they are for direct consumption, for merchandising, for warehousing, or for further processing. On the other hand, all goods leaving the country that are properly cleared through Customs are considered exports. A distinction, however, is made between exports of goods grown, mined, or manufactured in the Philippines (domestic exports) and exports of imported goods that do not undergo physical and/or chemical transformation in the Philippines (re-exports).
Since 1982, goods are considered imported on the date the carrying vessel or aircraft arrives at the port of unloading. In reverse, goods are considered exported on the date the carrying vessel or aircraft departs from the loading port.
SGD. SHERYL ANN A. JAMISOLA
Chief Statistical Specialist
| Attachment | Size |
|---|---|
|
|
595.98 KB |