

Release Date :
Reference Number :
SR-202410-0800-38
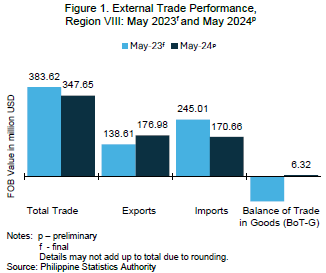
In May 2024, Eastern Visayas’ balance of trade in goods (BoT-G) bounced to USD 6.32 million. This indicated a trade surplus in contrast to the USD 106.40 million trade deficit incurred in May 2023 (Figure 1).
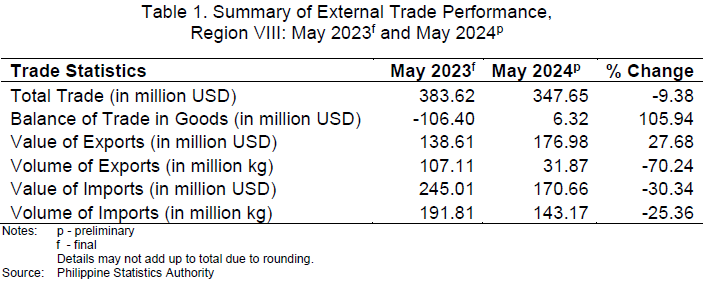
The total value of exports in May 2024 was USD 176.98 million, up by 27.68 percent from the USD 138.61 million exports in May 2023. Meanwhile, the total value of imports was USD 170.66 million in May 2024, posting an annual decline of 30.34 percent from the USD 245.01 million imports in May 2023.
Total external trade in May 2024 was USD 347.65 million, posting an annual decrease of 9.38 percent compared with the USD 383.62 million total trade in May 2023.
EXPORTS
 The total volume of goods exported by the region in May 2024 was 31.87 million kilograms, posting a decline of 70.24 percent from the 107.11 million kilograms of goods exported in May 2023 (Table 1).
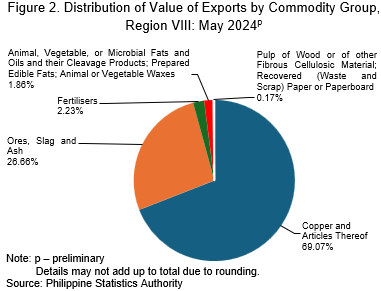
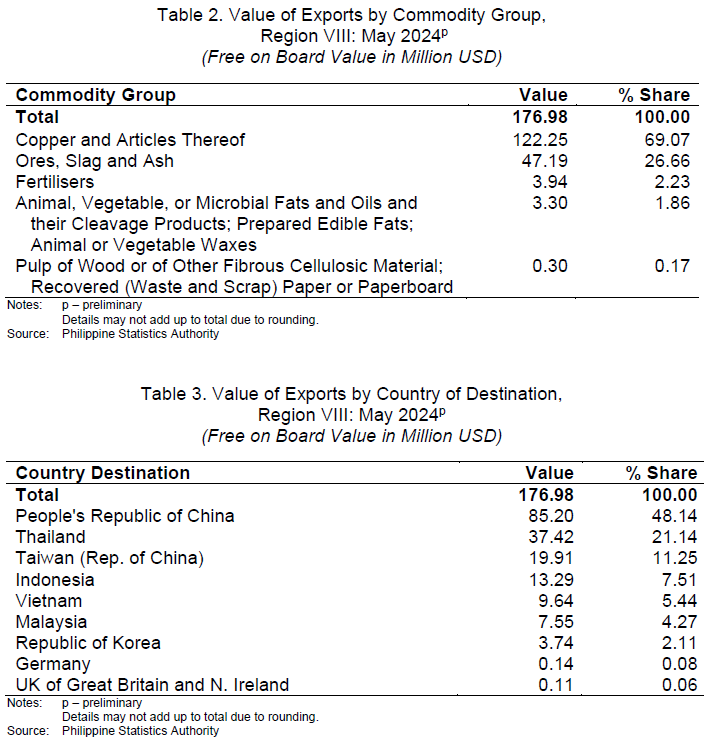
By commodity group, copper and articles thereof remained to be the region’s major export with sales amounting to USD 122.25 million. This accounted for 69.07 percent of the total value of exports in
May 2024. Ores, slag and ash commodity group worth USD 47.19 million comprised more than one-fourth (26.66%) of the exports during the month. Trailing behind with 2.23 percent and 1.86 percent share to the total export sales, respectively, were the commodity groups of fertilisers worth USD 3.94 million, and animal, vegetable, or microbial fats and oils and their cleavage products; prepared edible fats; animal or vegetable waxes worth USD 3.30 million. Pulp of wood or other fibrous cellulosic material; recovered (waste and scrap) paper or paperboard commodity group worth USD 0.30 million contributed 0.17 percent to the total value of exports of the region in May 2024 (Table 2).
The People’s Republic of China was the major export market with USD 85.20 million worth of exports or 48.14 percent of the total value of exports in May 2024. Completing the top five (5) export destinations were Thailand with USD 37.42 million (21.14%); Taiwan (Rep. of China) with USD 19.91 million (11.25%); Indonesia with USD 13.29 million (7.51%); and Vietnam with USD 9.64 million (5.44%) (Table 3).
IMPORTS
The total volume of goods imported into the region in May 2024 was 143.17 million kilograms, posting a decrease of 25.36 percent compared with the 191.81 million kilograms of goods imported in May 2023.
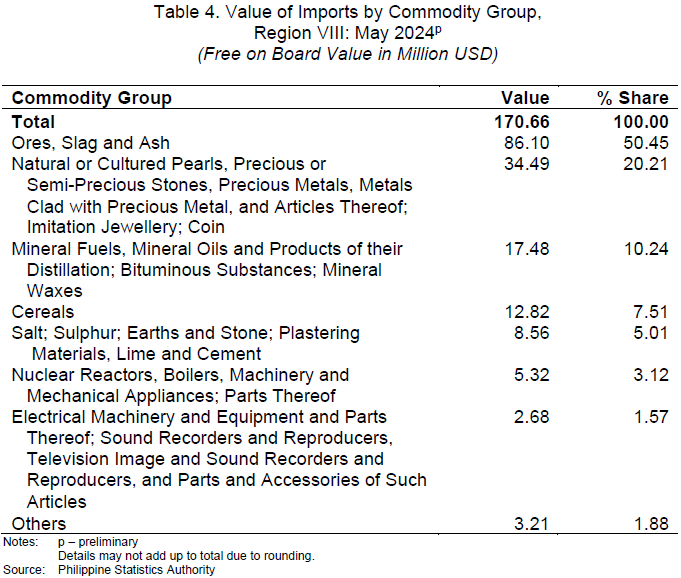
Ores, slag, and ash commodity group comprised more than half (50.45%) of the total import valued at USD 86.10 million. This was followed by the commodity group of natural or cultured pearls, precious or semi-precious stones, precious metals, metals clad with precious metals, and articles thereof, imitation jewellery; coin worth USD 34.49 million or 20.21 percent of the regions's total value of imports in May 2024. The commodity group of mineral fuels, mineral oils and products of their distillation, bituminous substances; mineral waxes worth USD 17.48 million comprised 10.24 percent of the region's total value of imports during the period in review. Imported cereals commodity group valued at USD 12.82 million accounted for 7.51 percent of the region’s total imports.
The commodity group of salt; sulphur; earths and stone; plastering materials, lime and cement worth USD 8.56 million shared 5.01 percent in the total import value of the region in May 2024. The commodity group of nuclear reactors, boilers, machinery and mechanical appliances; parts thereof valued at USD 5.32 million was 3.12 percent. Moreover, electrical machinery and equipment and parts thereof; sound recorders and reproducers, television image and sound recorders and reproducers, and parts and accessories of such articles worth USD 2.68 million was 1.57 percent; while other commodity groups combined worth USD 3.21 million contributed 1.88 percent to the region’s total imports in May 2024 (Table 4).
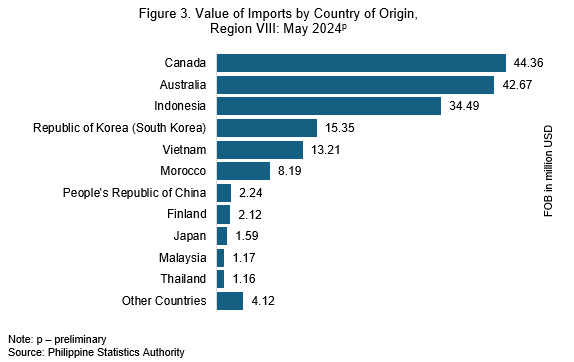
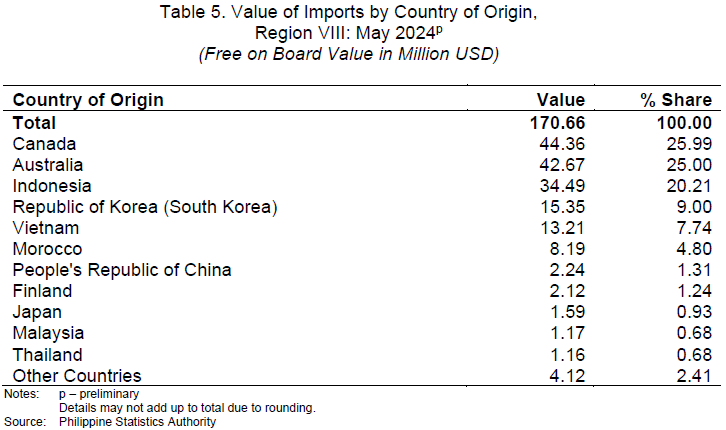
Canada and Australia supplied USD 44.36 million and USD 42.67 million worth of imported goods, respectively, each comprising a quarter of the total value of imports in May 2024. The rest of the top five (5) import suppliers during the month were Indonesia with USD 34.49 million (20.21%); Republic of Korea (South Korea) with USD 15.35 million (9.00%); and Vietnam with USD 13.21 million (7.74%) (Figure 3 and Table 5).
Technical Notes
Export and Import Trade Statistics are compiled by the Philippine Statistics Authority (PSA) from copies of export and import documents submitted to the Bureau of Customs (BOC) by exporters and importers or their authorized representatives as required by law. PSA collects copies of the following accomplished forms:
- Export Declaration (ED – DTI form)
- Import Entry & Internal Revenue Declaration (BOC IEIRD Form 236)
- Informal Import Declaration and Entry (BOC Form 177)
- Single Administrative Documents (SAD)
The output of the Automated Export Documentation System (AEDS) of the BOC is being utilized to generate export statistics. AEDS is a paperless transaction in lieu of the manual filling-up of export documents.
Moreover, an electronic copy of the IEIRD, or SAD, is utilized to capture the monthly import figures. SAD-IEIRD is an on-line submission of import documents either by brokers or companies. These are transactions that pass through the Automated Cargo Operating System (ACOS), now called the e2m (electronic to mobile) customs system, a system implemented through the BOC e-Customs Project.
All documents (hard copies and e-files) received before the cut-off date which is every 25th day of the month, are compiled, processed and generated in monthly statistical tables for the preparation of Press Release. All documents received after the cut-off date, however, are processed and included in the generation of the revised monthly statistical tables. Final data revisions are made annually during the first quarter after the reference year to include documents received after the monthly revisions.
The digitized copies of all documents are provided by BOC and PEZA to PSA on a monthly basis through email.
The 2022 Philippine Standard Commodity Classification (PSCC) is used to classify the commodities at the most detailed 10-digit code level for statistical purposes.
SGD. WILMA A. PERANTE
Regional Director