

Release Date :
Reference Number :
SR-202407-0800-31
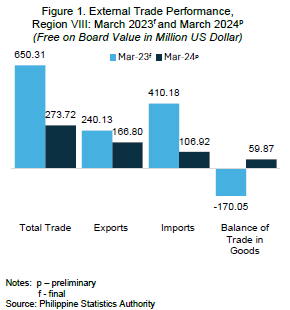
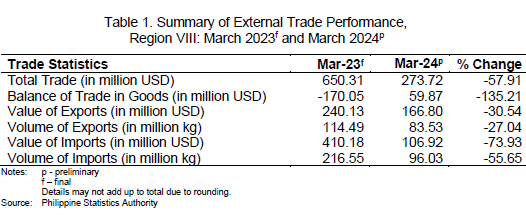
In March 2024, the Balance of Trade (Bo-T) in goods in Eastern Visayas bounced to a USD 59.87 million trade surplus, from a USD 170.05 million trade deficit in March 2023. This was attributed to the USD 166.80 million exports, which was higher than the USD 106.92 million imports in March 2024. However, compared to the data in March 2023, exports declined by 30.54 percent (USD 240.13 million); while imports declined by 73.93 percent (USD 410.18 million).
The total external trade performance in Eastern Visayas amounted to USD 273.72 million in March 2024. This indicates a decline of 57.91 percent from the USD 650.31 million total trade in March 2023 (Table 1).
EXPORTS
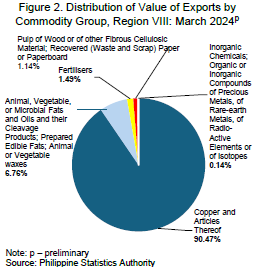
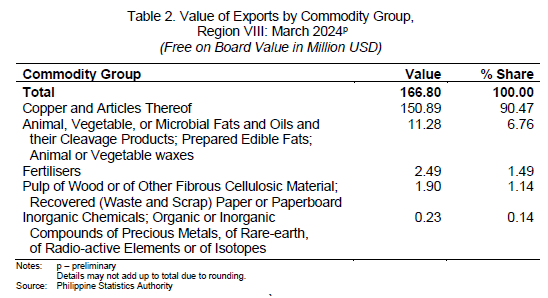
The total volume of goods exported by the region in March 2024 was 83.53 million kilograms with a total value of USD 166.80 million.
Copper and articles thereof commodity group dominated the exports market at USD 150.89 million in March 2024. This accounted for 90.47 percent of the total value of exports during the month. The commodity group of animal, vegetable, or microbial fats and oils and their cleavage products; prepared edible fats; animal or vegetable waxes valued at USD 11.28 million shared 6.76 percent to the region’s total exports in March 2024. Fertilisers commodity group valued at USD 2.49 million was 1.49 percent of the region’s total exports. The commodity group of pulp of wood or of other fibrous cellulosic material; recovered (waste and scrap) paper or paperboard worth USD 1.90 million was 1.14 percent of the region’s total export. Meanwhile, the commodity group of inorganic chemicals; organic or inorganic compounds of precious metals, of rare-earth, of radio-active elements or of isotopes contributed USD 0.23 million or 0.14 percent of the region’s total export (Table 2).
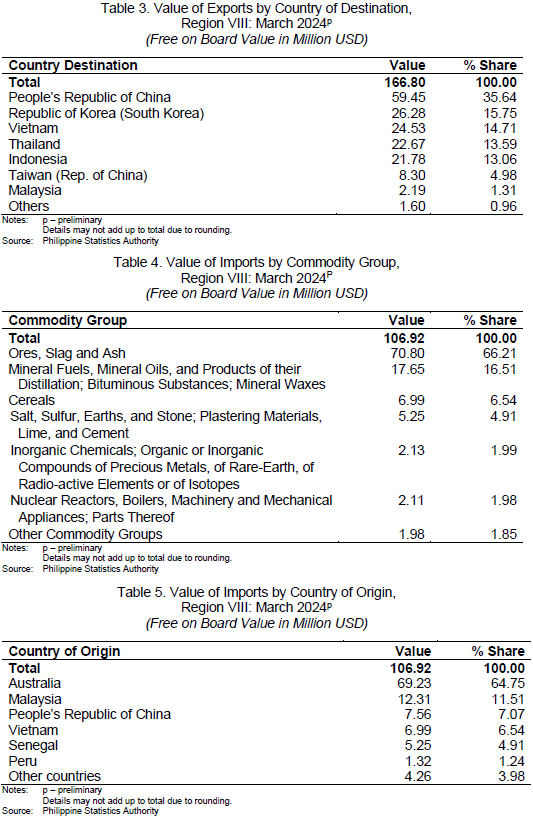
The People’s Republic of China was the main export market with USD 59.45 million worth of exports or 35.64 percent of the total value of exports in March 2024. Completing the top five (5) export destinations were Republic of Korea with USD 26.28 million (15.75%); Vietnam with USD 24.53 million (14.71%); Thailand with USD 22.67 million (13.59%); and Indonesia with USD 21.78 million (13.06%) (Table 3).
IMPORTS
The total volume of goods imported by the region in March 2024 was 96.03 million kilograms valued at USD 106.92 million.
Imports in March 2024 was led by the commodity group of ores, slag, and ash worth USD 70.80 million or 66.21 percent of the total value of imports of the region. This was followed by mineral fuels, mineral oils and products of their distillation; bituminous substances; mineral waxes commodity group worth USD 17.65 million which accounted for 16.51 percent of the region’s total exports. The region also imported cereals commodity group worth USD 6.99 million which comprised 6.54 percent of the total value of imports in March 2024.
The commodity group of salt, sulphur, earths and stone; plastering materials, lime and cement valued at USD 5.25 million accounted for 4.91 percent of the region’s total imports. Whereas, the commodity group of inorganic chemicals; organic or inorganic compounds of precious metals, of rare-earth, of radio-active elements or of isotopes worth USD 2.13 million was 1.99 percent. Nuclear reactors, boilers, machinery and mechanical appliances; parts thereof commodity group worth USD 2.11 million accounted for 1.98 percent. Meanwhile, other commodity groups contributed 1.85 percent to the region’s total imports in March 2024 (Table 4).
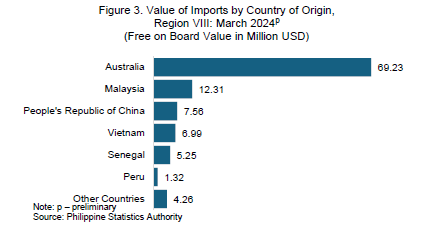
The major import supplier was Australia which accounted for USD 69.23 million or 64.75 percent of the total value of imports of the region in March 2024. The rest of the top five (5) import suppliers during the month were Malaysia with USD 12.31 million (11.51%); People’s Republic of China with USD 7.56 million (7.07%); Vietnam with USD 6.99 million (6.54%); and Senegal with USD 5.25 million (4.91%) (Figure 3 and Table 5).
Technical Notes
Export and Import Trade Statistics are compiled by the Philippine Statistics Authority (PSA) from copies of export and import documents submitted to the Bureau of Customs (BOC) by exporters and importers or their authorized representatives as required by law. PSA collects copies of the following accomplished forms:
1. Export Declaration (ED – DTI form)
2. Import Entry & Internal Revenue Declaration (BOC IEIRD Form 236)
3. Informal Import Declaration and Entry (BOC Form 177)
4. Single Administrative Documents (SAD)
The output of the Automated Export Documentation System (AEDS) of the BOC is being utilized to generate export statistics. AEDS is a paperless transaction in lieu of the manual filling-up of export documents.
Moreover, an electronic copy of the IEIRD, or SAD, is utilized to capture the monthly import figures. SAD-IEIRD is an on-line submission of import documents either by brokers or companies. These are transactions that pass through the Automated Cargo Operating System (ACOS), now called the e2m (electronic to mobile) customs system, a system implemented through the BOC e-Customs Project.
All documents (hard copies and e-files) received before the cut-off date which is every 25th day of the month, are compiled, processed and generated in monthly statistical tables for the preparation of Press Release. All documents received after the cut-off date, however, are processed and included in the generation of the revised monthly statistical tables. Final data revisions are made annually during the first quarter after the reference year to include documents received after the monthly revisions.
The digitized copies of all documents are provided by BOC and PEZA to PSA on a monthly basis through email.
The 2019/2022 Philippine Standard Commodity Classification (PSCC) is used to classify the commodities at the most detailed 10-digit code level for statistical purposes.
SGD. WILMA A. PERANTE
Regional Director
| Attachment | Size |
|---|---|
|
|
1.07 MB |