

Release Date :
Reference Number :
SR-0878-202101-01
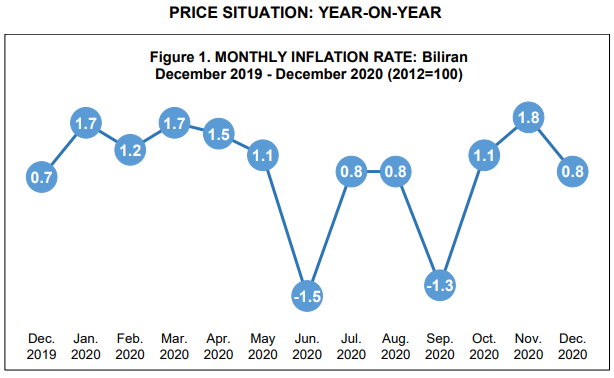
Biliran registered an annual headline inflation rate (IR) of 0.8 percent in December 2020. This figure is lower by 1.0 percentage points compared to its IR of 1.8 percent in November 2020 but slightly higher by 0.1 percentage points than its IR of 0.7 percent in December 2019.
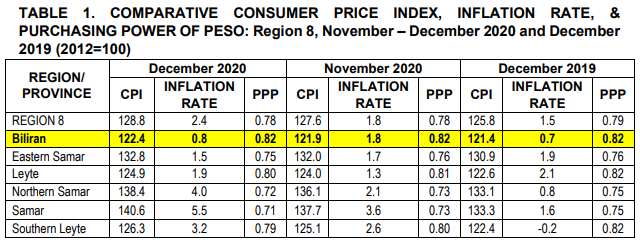
Moreover, the provincial IR in December 2020 is lower by 1.6 percentage points and 2.7 percentage points than the regional IR (2.4 percent) and national IR (3.5 percent), respectively.
As shown in Table 1, Biliran’s inflation rate ranked the lowest in the Eastern Visayas region.
In December 2020, the province reported an IR of 0.8 percent. This implies that the prices of commodities had faster price movements from its price levels in December 2019 at such rate. This refers to the All Items or the provincial market basket which represents the goods and services commonly purchased by households in Biliran.
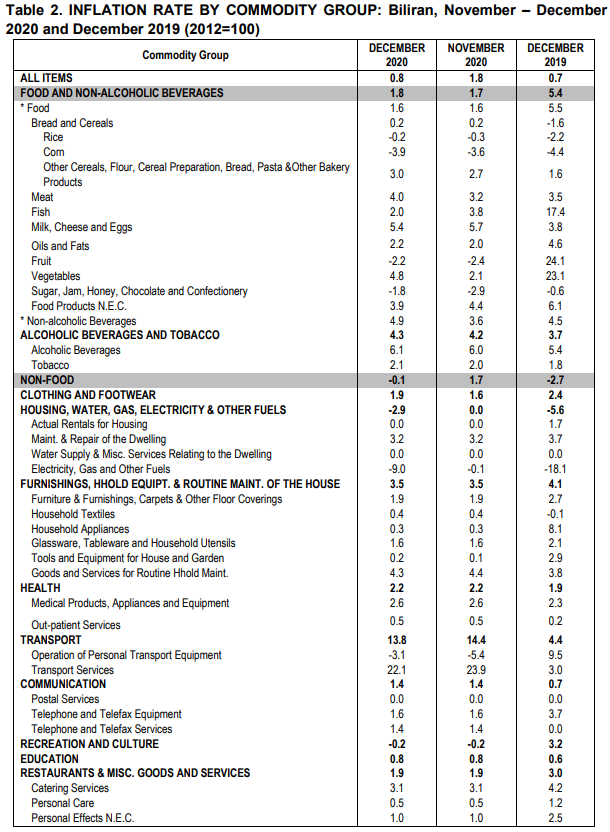
Among the eleven (11) commodity groups, the Transport group still set the highest IR at a slightly slower rate of 13.8 percent in December 2020 from 14.4 percent in November 2020. Following this is the Alcoholic Beverages and Tobacco with a higher IR of 4.3 percent and the Furnishings, Household Equipment & Routine Maintenance of the House with a sustained IR of 3.5 percent. On the other hand, the Housing, Water, Gas, Electricity & Other Fuels group posted the least with a deflation of 2.9 percent.
The Food and Non-Alcoholic Beverages group reported a slightly higher IR by 0.1 percentage points from 1.7 percent in November 2020 to 1.8 percent in December 2020. This can be traced to increases observed in the IR of most of the items under the group ranging from 0.1 percentage points to 2.7 percentage points.
Rice as the central commodity of the Filipinos still posted a deflation of 0.2 percent in December 2020 slightly increasing by 0.1 percentage points from a deflation of 0.3 percent in November 2020. This figure, however, is higher by 2.0 percent from its deflation of 2.2 percent in December 2019.
Similarly, the Non-Food category in general recorded a deflation of 0.1 percent in December 2020. This figure is higher by 1.8 percentage points from its IR of 1.7 percent in November 2020 as a result of the sustained IR observed in most groups under it.
Under this category, the Transport group have the highest IR at 13.8 percent followed by the Furnishings, Household Equipment & Routine Maintenance of the House group with an IR of 3.5 percent. The Recreation and Culture group, and the Housing, Water, Gas, Electricity & Other Fuels group posted the least with a deflation of 0.2 percent and 2.9 percent, respectively.
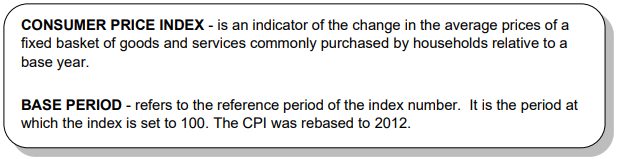
CONSUMER PRICE INDEX
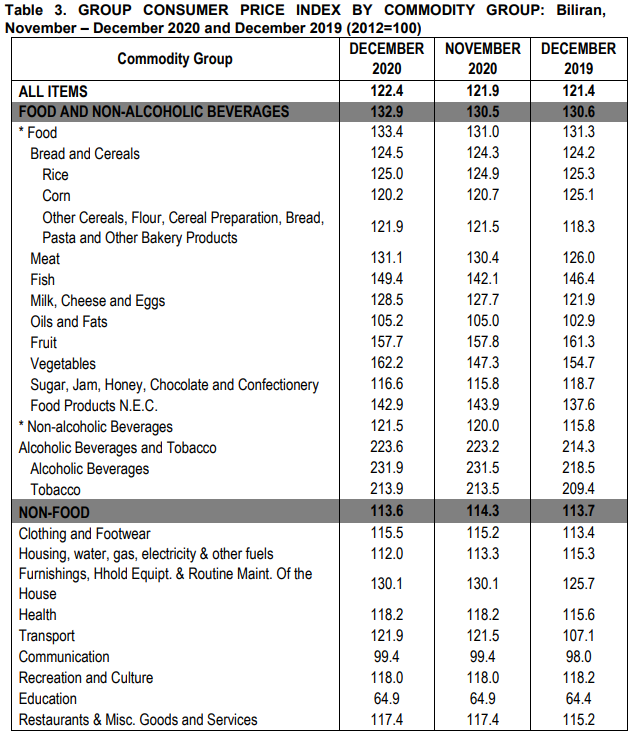
The Consumer Price Index (CPI) in December 2020 was recorded at 122.4 percent. This implies that the average level of prices of consumer goods and services purchased by households in December 2020 was higher by 22.4 percent compared with the prices in 2012.
In addition, the provincial CPI in December 2020 is lower by 3.8 percentage points and 6.4 percentage points compared with the national CPI of 126.2 percent and regional CPI of 128.8 percent, respectively.
Majority of the 11 commodity groups that was observed had sustained CPI levels in December 2020. These groups are (a) Furnishings, Household Equipment & Routine Maintenance of the House; (b) Health; (c) Communication; (d) Recreation and Culture; (e) Education; and (f) Restaurants & Miscellaneous Goods and Services. The rest of the commodity groups had increased CPI levels while only the Housing, Water, Gas, Electricity & Other Fuels group posted a decrease.
By commodity group, the Alcoholic Beverages and Tobacco group still posted the highest CPI with an increased level at 223.6. This was followed by the Food and Non-Alcoholic Beverages group at 132.9 and the Furnishings, Household Equipment & Routine Maintenance of the House at 130.1. In contrast, the Education group recorded the least with a sustained CPI of 64.9.
In general, the Food and Non-Alcoholic Beverages group posted an increase of 2.4 percentage points, from 130.5 to 132.9. This can be attributed to the increase in most of its items most especially the Vegetables.
In addition, the Alcoholic Beverages under the aforementioned group recorded the highest CPI at an increased level of 231.9 from 231.5, followed by Tobacco which also recorded higher CPI level at 213.9. The Oils and Fats, on the other hand, still recorded the least at 105.2.
On the other hand, the Non-Food category observed slightly lower CPI levels by 0.7 percentage points from 114.3 to 113.6. Under this category, the Furnishings, Household Equipment & Routine Maintenance of the House set the highest CPI at 130.1 while the Education group remained to have the least with a sustained CPI level at 64.9.
PURCHASING POWER OF PESO
The price changes reflected in the CPI caused the value of the national currency in Biliran to have a value of 0.82.
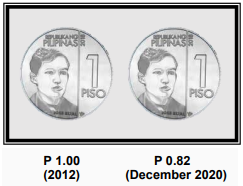
The PPP of 0.82 means that our peso, as of December 2020, significantly lost its value and had been eroded by almost 18 centavos over a period. This means that you need P121.95 this 2020 to be able to buy the same amount of goods and services valued at P100 in 2012 which is the base year.
The province’s PPP is higher than the regional peso and is the highest in the region (Table 1).
TECHNICAL NOTES
The current CPI series is 2012-based. The five steps involved in the rebasing/computing of the CPI are as follows: (1) identification of the base year (2) determination of the market basket (3) determination of household consumption patterns (4) monitoring of prices of items in the basket and (5) computation of the CPI.
REBASING THE CPI - is necessary to ensure that this barometer of economic phenomena is truly reflective of current situation. Consumer taste, fashion and technology change over time causing the fixed market basket of goods and services to become outmoded. To capture such changes for a more meaningful price comparison, revision or updating of the fixed market basket, the sample outlets, the weights and the base year had to be done periodically.
MARKET BASKET - refers to a sample of goods and services used to represent all goods and services bought by a particular group of consumers in a particular area.
WEIGHTS - The weights for the 2006-based CPI were derived from the expenditure data of the 2006 FIES, a nationwide survey that covered around 44,542 sample households. The weight for each item of expenditure is a proportion of that expenditure item to the total national expenditure. The total (all items) national expenditure weights is equal to 100.
MONITORING OF PRICES - is to establish baseline information for prices of the items in the base year and monitoring of the prices of the items on a regular basis. Except for Food, Beverage and Tobacco which is monitored on a weekly basis in NCR, price collection is done twice a month. First collection phase is done during the first five days of the month while the second phase is on the 15th to 17th day of the month.
COMPUTING THE CPI - The formula used in computing the CPI is the weighted arithmetic mean of price relatives, a variant of the Laspeyres formula with fixed base year period weights.
RETAIL PRICE - refers to the actual price at which retailers sell a commodity on spot or earliest delivery, usually in small quantities for consumption and not for resale. It is confined to transactions on cash basis in the free market and excludes black-market prices and prices of commodities that are on sale as in summer sales, anniversary sales, Christmas sales, etc
SGD. RENAVIL V. CUEVA
Chief Statistical Specialist